
By Tyler Durden at ZeroHedge
While the primary topic of Albert Edwards’ most recent note is the question how long China can sustain its FX intervention before tapping out and letting the hedge funds win with their short Yuan bets once total reserves drop below the critical redline of $2.7 trillion (the answer incidentally is between 5 months and 10 months assuming monthly reserve burn rates of $130BN to $60BN), we will skip that part as we have discussed it extensively in the past, and instead will fast forward to some chart porn by the SocGenarian.
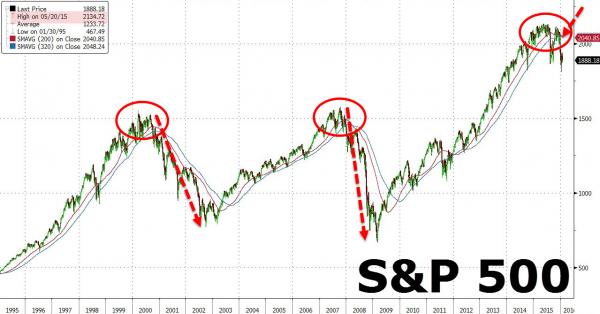
Here is Albert Edwards showing that the S&P had breached key moving averages normally seen at the start of a bear market.
Back in the mid-1990s I spent three memorable years working at Bank America Investment Management, among some of the industry’s finest. Having previously spent three years as an economist at the Bank of England, I was new to markets and I let my economic enthusiasm often get the better of me when making recommendations to fund managers.I remember the head of fixed income explaining to me it was far better not to try and pick market tops or bottoms but to wait and observe the market turn, making the trade late rather than prematurely trying to pick the bottom or top.So the chart below is notable, showing that key 200d and 320d moving averages for the S&P have just been breached to the downside. If one is looking for key technical indicators to ring the bell on the cyclical bull market- maybe it has just rung loud and clear.A renminbi devaluation will only sever an already badly frayed safety rope.
Check to you, “data-dependent” Fed
Source: “A Key Indicator Just Rang The Bell On The Cyclical Bull Market” – ZeroHedge

