
Data on motor vehicle sales is released at the beginning of every month. It doesn’t get a lot of attention. But it’s interesting and useful data for investors. First, it’s timely, released almost immediately after the end of the month with virtually no lag. Second, it’s not manipulated by government statisticians. It’s based on actual sales reported by the manufacturers. There’s no estimating. There’s no seasonal manipulation. And there’s no inflation component. It’s hard data.
Third, there’s plenty of historical data, so we can see how sales are performing not just in the short run, but also with the perspective of the long term. We can learn a lot about the short term momentum of the US economy and its long term secular growth. By plotting the data on a graph, it’s easy to interpret and to gain perspective.
Economic data doesn’t do investors much good if it doesn’t correlate well with stock prices. Auto sales data does, but there has been a telling change in recent years. The correlation has been veering away from the normal relationship with stock prices since 2013. The change has not been positive. In fact, quite the opposite.
When we look at correlations, there’s always a question of cause and effect. Contrary to conventional wisdom, high correlation actually does imply cause and effect. It may not prove it, and sometimes it is coincidental, or there’s a third driver that pushes both series in the same direction. But it’s always a good idea to investigate the rationale for the correlation. We may be able to glean something from that about the current situation, and what it means for the future.
In the case of the high correlation between auto sales and stock prices, there’s a prima facie case of cause and effect. Clearly, rising auto sales don’t cause rising stock prices. But all of us either have used a stock market profit to make a big ticket purchase, or know someone who has. Or we know people who have felt more secure financially as a result of rising stock prices, and have made purchases because of that.
Rising stock prices can induce some people to make purchases that they might otherwise might not have made. We also know that this relationship doesn’t apply to everyone, and only works for so long. Then it doesn’t work any more. It is artificial stimulus that is always accompanied by an increase in debt. In the long run, that debt becomes a drag.
Auto sales and stock prices are both dependent to a great extent on the common driver of monetary policy. Easy money tends to contribute to both stock purchases and automobile purchases. So it is no surprise that for decades the two series moved in close correlation to one another. But again, somewhere along the line, debt morphs from being a driver to being a drag. So the correlation works in both directions.
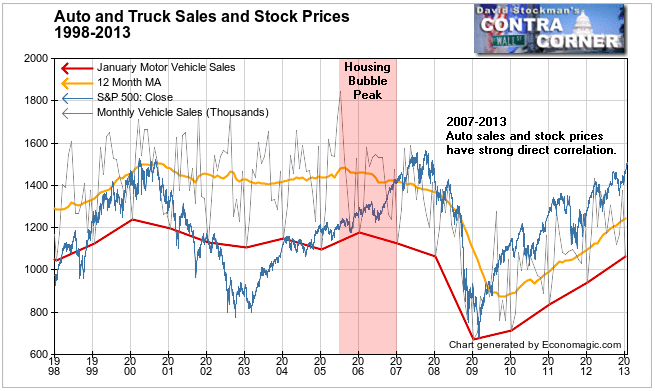
The correlation between light vehicle sales and stock prices was very strong from 1998 to 2013, with the exception of one period, mid 2005 to late 2007, as the housing bubble was topping out and rolling over. That’s because during the housing bubble, homeowners used their houses as ATMs more than they withdrew profits from stocks. As house prices rose, many owners cashed out equity with a home equity loan, in order to make big ticket purchases like cars.
But the housing bubble hit peak sales volume in mid 2005. And it wasn’t long before homeowners and bankers began to worry about that. Home prices topped out in 2006, after sales had collapsed. By mid 2007 sales prices were falling. Auto sales tracked that whole curve closely.
But stock prices marched merrily higher until late in 2007. Stock investors always seem to be the last to get the news. That’s partly because Wall Street is constantly singing the tune, “Everything Is Gonna Be Alright,” and investors are willing believers. But the steady decline in auto sales in 2006 and 2007 that tracked the slow rollover of the housing bubble, showed clearly that the bloom was off the rose. Stock prices had become “irrationally exuberant” while the housing bubble was popping and the US economy was preparing to plunge into deep recession. This was one instance where the economy led the stock market. It happens mostly at tops.
As usual, at the bottom, when the Fed opened the liquidity floodgates and rapidly took interest rates down to zero, it didn’t take long for car sales to begin to track stock prices higher. From 2009 through 2013 there was nearly a one to one direct correlation between the S&P 500 and average monthly light vehicle sales. Rising stock prices were at least contributing to rising auto sales, although both were probably more an effect of the Fed printing money and suppressing interest rates in the process.
But something strange happened beginning in 2013. The Fed kept printing money and suppressing interest rates, and stock prices kept rising. But light vehicle sales began to diverge. The increasing debt burden was beginning to exert its inevitable drag on the economy.
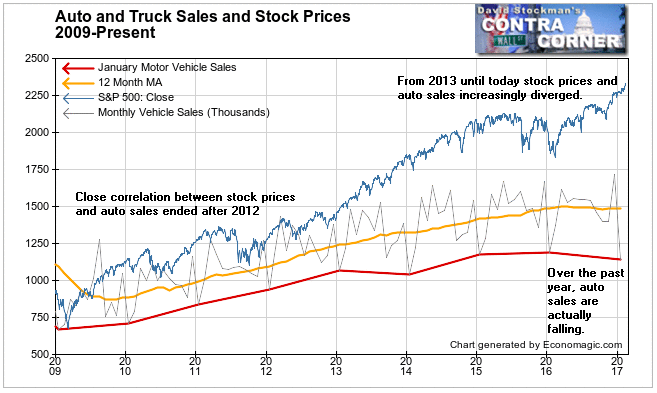
Apparently, fewer and fewer people were benefitting economically from rising stock prices. This isn’t news of course, but here’s empirical data that supports the case. If a broad segment of the public was actually richer, or feeling richer, they would be buying cars at a pace reflecting the rise in stock prices. Instead, not only has growth in auto sales slowed, it has turned negative over the past year.
And it’s not as though the economy was facing any headwind from home prices. Home prices have again risen to all time highs. Many people again have the ability to extract home equity, in particular, virtually anyone who has bought a house since 2008. So according to Trickle Down Theory there should be nothing holding buyers back. But there is.
According to Motor Intelligence, light vehicle sales, including passenger cars and light trucks, totaled 1.14 million units in January. That was 1.8% lower than in January 2016. In contrast, stocks had risen about 10% over that period.
Not only was the year to year comparison bad, but the monthly performance in January was horrid. It dropped 33% from November. A drop from November to December is typical, but the 33% decline was worse than any December in the previous 10 years, including during the recession. The year to year decline and the horrible monthly performance are clear signs that the US economy is slowing, and may have even already gone into recession.
Meanwhile stock prices bubble higher as investors bet that Trumponomics will drive a rebound in the economy and justify higher stock prices. From the perspective of auto sales, which led the last bear market and economic recession by a year or more, it does not look like a good bet.
Lee Adler first reported in 2002 that Fed actions were driving US stock prices. He has tracked and reported on that relationship for his subscribers ever since. Try Lee’s groundbreaking reports on the Fed and the Monetary forces that drive market trends for 3 months risk free, with a full money back guarantee. Be in the know. Subscribe now, risk free!

