In the technical notes for the Employment Situation Report, the payroll numbers that everyone obsesses over in fine detail, the BLS still shows a 90% confidence interval at 1.6 standard deviations that works out to +/- 115k. That means that whatever number gets splashed onto every headline and worked into every major commentary piece isn’t really the number of payroll changes. It is a statistical estimate that only anchors that confidence interval.
What the BLS actually reported for August was that if they gathered all the data again and again100 times, it is expected that in ninety of those the payroll gain would fall in a range of +266k at the upper end of the confidence interval and +36k at the lower end. That changes the interpretation dramatically from the certainty that is reported about how there was a “disappointing” 151k jobs created in August 2016. In fact, given that confidence interval, it could be that the true amount of job gains was something like 266k and consistent with the mainstream interpretation of the past two months that made everyone forget all the economic problems, or closer to +36k and the disaster that so unnerved everyone in the May report (and anything in between those extremes).
There is entirely too much focus and deference to the individual monthly figures; they tell us very little in the end. That is even more the case in the past two years where purported job gains, statistical or real, have proved completely irrelevant to the overall state of the economy. And that discrepancy has led even further into the wrong direction; rather than question the payroll numbers as statistics, the fact that the BLS figures have been in a world of their own has caused this emotional response where the media and economists now scrutinize the fine details of each monthly payroll estimate that much more. The mainstream has declared even more meaning out of desperation even as the usefulness of the jobs report actively declines (as if such accuracy was ever possible in the first place).
Thus, like other accounts and data points like the Chicago PMI, this unstable economy has produced wild, manic swings in emotion, almost schizophrenic in how the data is treated and interpreted. The May report caused widespread abhorrence; only to be set aside in June and then euphoria in July which appeared to confirm June as solid evidence May was an aberration. Then the August figures are released and now questions abound again, bringing up the more uncomfortable scenarios about what really happened over the last year in the economy.
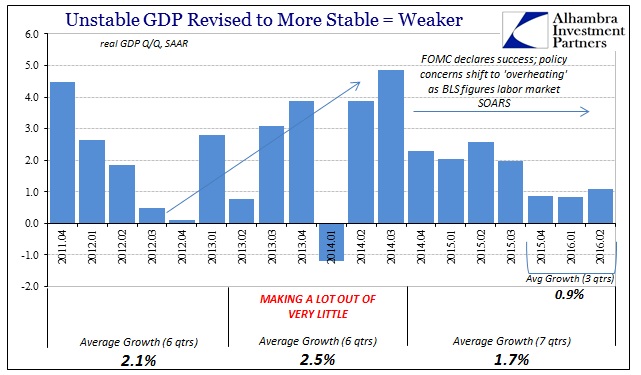
By their very nature, the statistical construction of the payroll numbers argues immediately for a wider perspective further away from the monthly variations. Using a 6-month average we find a more consistent trend, not just in direction but more so that the direction is the same as the rest of the economic data.
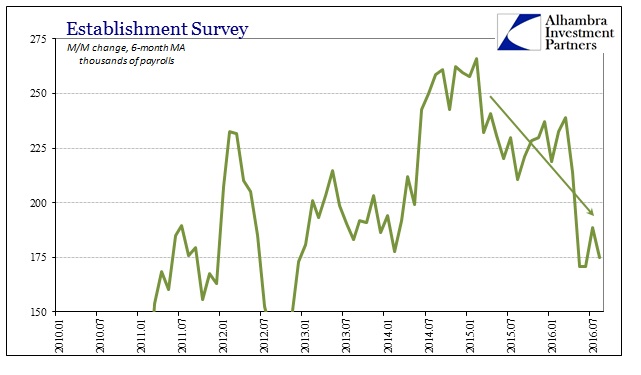
I still have major reservations about the gains estimated for the summer of 2014, but even setting those aside we find here a clear slowing trend that starting at the outset of 2015 is compelling in its coincidence to everything from oil prices to retail sales to the “manufacturing recession” both here and abroad. The true issue of interpretation, then, is what that slowing ultimately means for the labor market and then the economy overall. If the 2014 job gains were real, then this current deceleration might be nothing more than falling back to a more normal (for this depression) pace of gains – and still uneven in how these gains are figured and counted.
If, however, you view the 2014 baseline as suspiciously overwrought given the molehill of improvement that year as compared to the pretty bleak years (2012 & 2013) before, then removing what might be a statistical aberration of trend-cycle subjectivity produces a very familiar pattern.

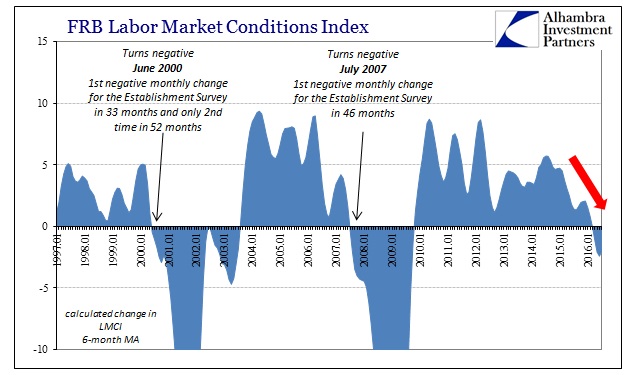
In this hypothetical view, the slowing of the past two years of the “rising dollar” would lead instead to the same (negative) interpretations as we find in all those other economic accounts. Among them is the Federal Reserve’s own factor model for the labor market, the LMCI.
Given the statistical weakness of the data published in the Current Employment Situation Report, we are left with few solid interpretations. The primary analysis leads us to conclude that the labor market has almost certainly slowed over the past two years. To what degree and from what starting point is unclear using just these figures. Apart from that, the instability in the monthly variations while somewhat expected is perhaps more extreme of late than it had been up until 2014. That would also be in agreement with instability in so many other accounts both related and unrelated, and further argue for the unsettled economy that we observe all over the world.
While the focus will continue to be on trying to parse +151k, the only solid result from the payroll report for August was as it has been for years: slowing. That is a huge problem for any economy let alone this one where they was never a recovery to begin with (depression).