
There has been a lot of chatter in recent days about the plunge in commodity prices—–capped off by this week’s slide of the Bloomberg commodity index to levels not seen since 2002. That epochal development is captured in the chart below, but most of the media gumming about the rapidly accelerating “commodity crunch” misses the essential point.
To wit, the central banks of the world have shot their wad. Accordingly, the 12-year round trip depicted in the chart is not about the end of some nebulous “commodity supercycle” that arrived from out of the blue after the turn of the century. Nor, most certainly, is it evidence of the Keynesians’ purported global shortage of “aggregate demand” that can be remedied by an even more extended spree of central bank monetary stimulus.
No, the Bloomberg Commodity index is a slow motion screen shot depicting the massive intrusion of worldwide central bankers into the global economic and financial system. Their unprecedented money printing rampage took the aggregate balance sheet of the world’s central banks from $3 trillion to $22 trillion over the last 15 years.
The consequence was a deep and systematic falsification of financial prices on a planet-wide scale. This unprecedented monetary shock generated a double-pumped economic boom—–first in the form of an artificial debt-fueled consumption spree and then a sequel of massive malinvestment.
Now comes the deflationary aftermath. Soon there will follow a plunge in corporate profits and collapsing prices among the vastly inflated risk asset classes which surfed on these phony booms.
So it is worth recounting how we got here. In the first phase, central banks engineered a massive wave of household borrowing and consumption/housing spending in the DM economies which, in turn, ignited an export manufacturing boom in China and among its caravan of EM suppliers. This China/EM export boom eventually over-taxed the world’s existing capacity to supply the raw materials required by a booming industrial economy—hydrocarbons, iron ore, met coal, aluminum, copper, nickel etc.
The resulting commodity price boom peaked on the eve of the Great Financial crisis and was crystalized when oil hit $150/barrel in July 2008. During the 2007-2008 initial peak period, the spread between cash costs of production and soaring commodity and materials prices was inflated to unprecedented size, generating vast economic rents that accrued to owners of existing production assets and reserves.
Even though DM consumption spending and demand for global exports was not sustainable, the pre-crisis windfalls naturally generated a surge of capital investment in search of supra-normal returns. But then the central bankers doubled down in the face of collapsing global trade and the liquidation of DM domestic economic excesses in the fall and winter of 2008-2009.
Indeed, the desperate scramble by governments and their central banking branches to dig out from under the plunge in consumer spending and the subsequent liquidation of dodgy mortgages, excess inventories of manufactured goods and over-stocked labor in the DM economies triggered the second artificial economic boom. This time it was manifested in a renewed frenzy of CapEx and public infrastructure spending in China and the EM economies.
To the pull of windfall profits in global mining, energy, materials, shipping and manufacturing was added the push of dirt cheap central bank enabled credit on an heretofore unimagined scale. In the case of China, for example, public and private credit outstanding at the end of 2007 amounted to just $7 trillion or about 150% of its GDP. During the next seven years—-owing principally to Beijing’s maniacal stimulus of domestic infrastructure investment designed to replace waning exports——China’s now completely unhinged credit machine generated new debt equal to triple the 2007 amount, thereby bringing credit outstanding to $28 trillion or nearly 300% of GDP at present.
Adding fuel to the fire, DM central bankers drove interest rates to the zero bound in a foolish quest to jump-start spending by debt-saturated households. But this did not cause consumers to spend more in the US, England, Spain, Italy, Greece or France because the vast middle classes of these DM economies were already at “peak debt”. Instead, it generated a madcap scramble for yield among money managers and an eventual capital outflow of $4-5 trillion into EM debt markets.
Taken together, the combination of unprecedented financial repression in DM capital markets and the prodigious expansion of domestic business credit in China and the EM elicited a tidal wave of capital investment unlike the world has ever witnessed. This put a renewed round of pressure on commodities that caused a second surge of prices which peaked in 2011-2013.
The torrid demand for commodities during this second wave resulted in part from the need to feed cement, steel, copper, aluminum and hydrocarbons into the maw of China’s massive infrastructure, high rise apartment and commercial building projects and similar construction booms in other EM economies. And on top of that was another whole layer of demand for the raw materials needed to build the ships, earthmovers, mining machinery, refineries, power plants and steel furnaces and mills that were directly embodied in the capital spending spree.
Stated differently, the torrid demand for construction steel in China indirectly led to demand for more iron ore bulk carriers, which in turn required more plate steel to supply China’s shipyards which were given the contracts to build them. In short, a capital spending boom creates a self-feeding chain of materials demand——especially when its fueled by cheap capital costs and the economically false rates of return embedded in long-lived capital assets funded by it.
And therein lies the origins of the deflationary wave now rocking the global commodity markets. Neither the DM consumer borrowing binge nor the China/EM infrastructure and industrial investment spree arose from sustainable real world economics. They were artifacts of what history will show to be a hideous monetary expansion that left the DM world stranded at peak household debt and the EM world drowning in excess capacity to produce commodities and industrial goods.
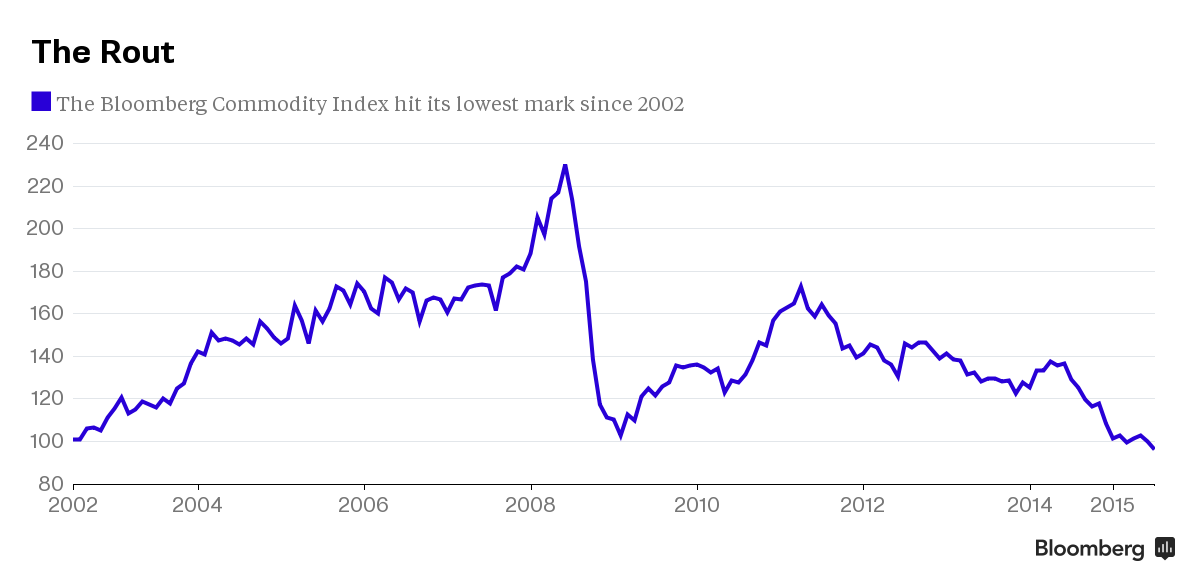
The reason that the Bloomberg index will now knife through the 100 index level tagged on both the right- and left-hand side of the chart is the law of supply and demand——along with its first cousin called variable cost pricing and a destructive interloper best described as zombie finance. The latter is what becomes of central bank driven bubble finance when the cycle turns, as it is now doing, from asset accumulation and inflation to asset liquidation and deflation.
But to understand the potentially devastating extent of the coming asset deflation cycle, it is important to reprise the extend of the just completed and historically unprecedented global capital investment boom.
Thus, in the case of the global mining industries, CapEx by the top 40 miners amounted to $18 billion in 2001. During the original boom cycle it soared to $42 billion by 2008, and then after a temporary pause during the financial crisis, reaccelerated once again, reaching a peak of $130 billion in 2013. Owing to the collapse of commodity prices as shown above, new projects and greenfield investments have pretty much ground to a halt in iron ore, met coal, copper and the other principal industrial materials, but there is a catch.
Namely, that big projects which were in the pipeline when commodity prices and profit margins began to roll-over in 2012, are being carried to completion owing to the sunk cost syndrome. This means that available, on-line capacity continues to soar. The poster child for that is the world’s largest iron ore complex at Port Hedland, Australia. The latter set another shipment record in June owing to still rising output in the vast network of iron mines it services——-a record notwithstanding the plunge of iron ore prices from a peak of $190 per ton in 2011 to $47 per ton a present.
The ramp-up in E&P investment for oil and gas was similar. Global spending was $100 billion in the year 2000, but had risen to $400 billion by 2008 and peaked at $700 billion in 2014. In the case of hydrocarbon E&P investment, however,the law of variable cost pricing works with a vengeance because “lifting costs” even for shale and tar sands are modest compared to the front-end capital investment. Accordingly, the response of production to plunging prices has been initially limited and will be substantially prolonged.
Similar cycles occurred in utilities, shipping, manufacturing, ports and warehousing and other process industries like chemical production. In the case of the steel industry, for instance, global capacity doubled from 1.1 billion ton to more than 2.3 billion tons during the past 15 years——far outstripping current demand. In fact, the 600 million tons of excess capacity shown in the chart below will grow considerably larger as the demand for steel embedded in the completion phase of the rapidly cooling global CapEx boom winds down.
So in this industry alone excess capacity could easily reach 35%. Most of that is in China, Brazil, Mexico and elsewhere in the EM, and amounts to more than the combined steel industry of the US, Europe and Japan.

According to Thompson Reuters, in fact, the global capital spending total for all listed companies on a worldwide basis went nearly parabolic after the turn of the century.
Thus, during the preceding decade (1991-2001), and not withstanding the technology boom of that period, global CapEx for manufacturing, transport, construction, process industries and utilities rose from $450 billion to $700 billion or at a 4.5% annual rate. By contrast, during the capital spending boom which peaked in 2013, outlays accelerated to $2.6 trillion annually. This means that capital spending nearly quadrupled, rising at a 12% annual rate over the course of 12 consecutive years.
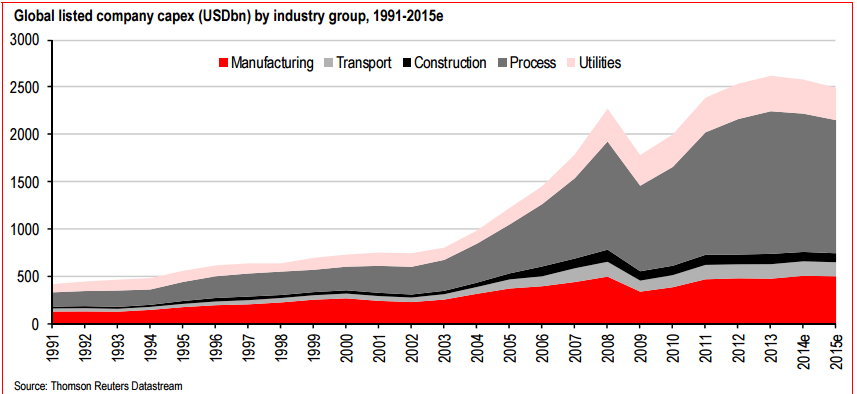
Since 2013 that staggering total has begun to roll-over, but the lagged effect of the project completion cycle has temporarily braked the fall. Accordingly, excess capacity continues to build, meaning that the cliff-diving phase of commodity and industrial prices and profit margins has just begun, and that the top-line in the chart above will be plunging sharply southward for years to come.
And that’s where central bank enabled zombie finance comes in. Production cuts and capacity liquidations in virtually every materials sector are being drastically delayed by the continuing availability of cheap finance.
So what “extend and pretend” really means is that prices and margins will be driven even lower than would otherwise be the case in the face of excess capacity. Stated differently, the correlate of zombie finance is flattened profits for an unusually prolonged period of time.
Here the thing. During the central bank driven doubled-pumped boom, profits margins rose to historically unprecedented levels because scarcity rents were being captured by producers during most of the past 15 years.
Now comes the era of gluts and unrents. And as will be shown in part 2, the casino is most definitely priced as if scarcity rents were a permanent fixture of economic life——when they were actually a freakish consequence of the central bankers’ reign of bubble finance.
Yes, the central bankers may try a while longer to stimulate GDP in a futile quest to enable the monumental debts they have fueled to be serviced and the massive excess capacity to be absorbed. But they have only one tool—namely, financial repression and the systematic falsification of financial market prices, especially the carry costs of debt.
But resort to the monetary hammer will drive home no more economic nails. It will only feed the zombies, inflate the bubble in financial asset prices further and insure that when the day of reckoning finally comes the casino will be in for a rude awakening.

