
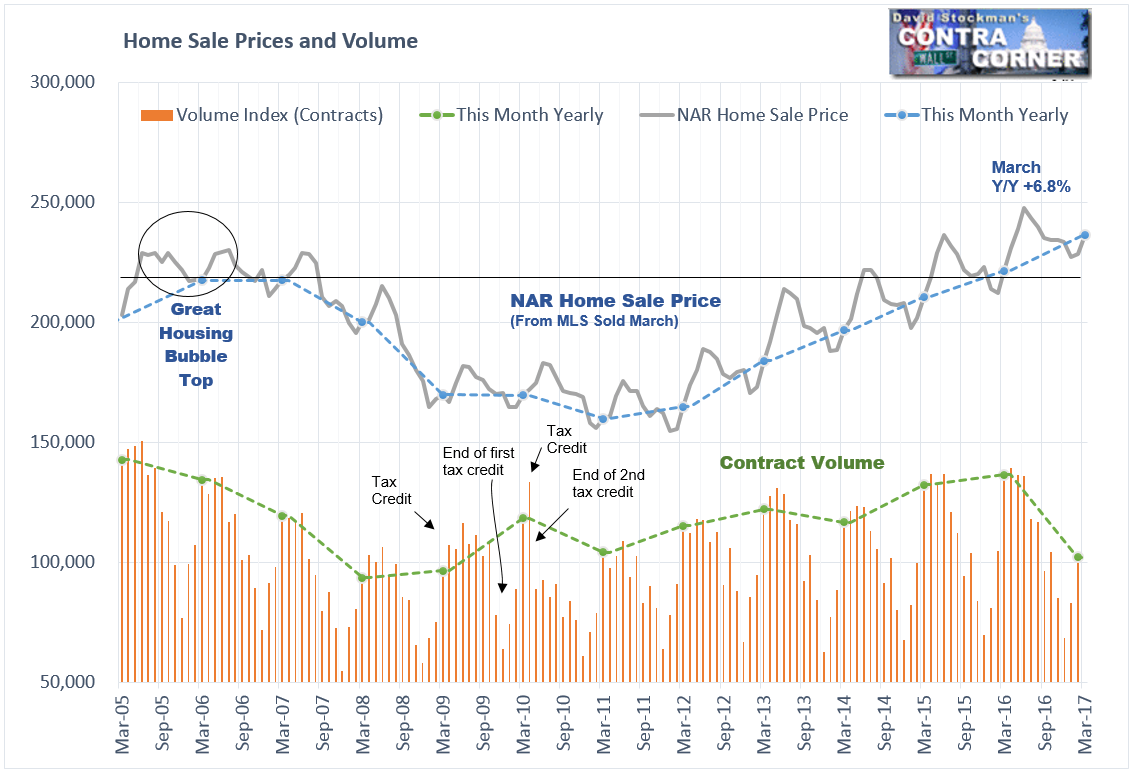
The NAR reported home sale prices on Friday. Prices of houses going under contract in March rose by 6.8% on a year to year basis. That’s off a bit from a 7.7% increase in February, but it is still a red hot number.
The NAR figures are the best measure of current home sales prices. They are collected from a broad spectrum of regional and metro Multiple Listing Services across the US. They report the sale prices on contracts reached during that month about 3 weeks after the end of the month. It’s as near to real time as you can get.
These sales reports are essential to Realtors in operating their businesses. The agents participating in the sale report the price to the MLS as soon as the sales contract is signed. I know this because I spent 20 years in the real estate sales, appraisal, and mortgage finance businesses. Everybody relies on that data. It has to be accurate.
The NAR accumulates the data and reports it as is, without the smoothing that causes other real estate price indexes like Case Shiller to lag the market to the point of uselessness. Importantly, the NAR doesn’t bother with the silliness and smoothing inherent in seasonal adjustment. This is raw, hard data. In all the years that I have been tracking the aggregate data, I have never seen any evidence that would cause me to believe that it was not an accurate representation of trend. It’s very easy to see the trend and compare it to past performance by plotting it on a chart.
After an initial burst off the lows of the housing collapse, since 2013 home prices have been inflating on almost a straight line. The March year to year housing inflation rate has ranged between +5.1% and +7.1%. The current figure of +6.8% is near the high end of the range. As a market technician however, I note the sharp drop in February contract volume. That tells me that the recent gains are not sustainable. In addition, March sale closings had an astronomical rise, going against the trend in contracts. It suggests that buyers, sellers, and bankers are all in a panic to get sales closed fast. That creates a dearth of demand dead ahead.
While signs of a pending housing market crash are building again, it hasn’t happened yet and may still be a few months away. Home prices are likely to keep rising for a while longer. But if volume is fading, another housing bubble “correction” won’t be far behind.
These increases in housing prices do not show up in official inflation measures. The BLS does not count house prices in the CPI. It argues that houses are not consumption goods. They are assets. The BLS uses a substitute measure called Owners Equivalent Rent (OER) to measure housing inflation. Then they suppress that so that it doesn’t measure housing inflation accurately either.
OER is based on an occasional survey of renters, with monthly changes extrapolated between survey periods. Importantly, the surveys are not based on market rent, that is, the actual rent charged for like units in the market. They are based on contract rent, which understates actual market rent inflation over time. When a tenant decides to move– BOOM! Sticker shock as they face the reality of the marketplace. CPI recognizes none of that. It does not measure actual housing prices, and it does not measure market rent.
Why is that so important? Because the BLS assigns the housing component of CPI a weight of 41% of Core CPI. When it massively understates housing inflation, that has a huge impact on Core CPI. Housing has a weighting of 31% of headline CPI, so even there suppressing the housing component has a significant impact.
If the BLS limited its survey to tenants who had just signed a lease, just like it does with car sales, for instance, then rent inflation would be accurately measured. But under the current method the vast majority of those surveyed have been in their homes for at least several years. They are not reporting market rent. They are reporting their own contract rent. This is almost always set in the original lease at either CPI or some nominal fixed rate of increase such as 2% or 3%. It doesn’t matter if rents in the market are rising 5-10% as they have been in recent years. The rent component of CPI shows up as being 2-3%.
Over time, most tenant occupied units become what real estate professionals call “under rented.” That means that they are below market rent. They do not reflect what renters would pay in the marketplace if they moved today. As rent inflation heats up in the market, contract rents fall further and further behind, resulting in the rent component of CPI grossly understating the actual rate of rent inflation. As a result these surveys do not measure inflation at all.
As market rent heats up, contract rent and the rent component of CPI (OER) begin to increase. But it usually lags the market by a year or two, and never catches up completely. Recently, OER has plateaued around a rate of 3.5% year to year. It has leveled off because rent increases fell sharply last year. Market rent as reported in the Census Bureau’s quarterly housing survey fell from an 11% increase in late 2015 to a rate of less than 2% in Q4 of 2016. Meanwhile, OER moves along in a steady state universe, where prices don’t fluctuate, they just slowly accelerate in nearly a straight line. Yeah, that’s reality to the BLS. Unfortunately, it doesn’t work that way in the real world. Real markets fluctuate.
Private surveys such as that by ApartmentList.com reported that rents rose sharply year to year in January and February. The annual rate is now +2.4%. Rents are up 1.8% since December alone in their survey. I don’t like to annualize quarterly numbers, but the year is off to a flying start, implying another rebound year after a year of slow increases. Those figures reflect thousands of rental units of all types all over the US. Both their data and the Census Bureaus market rent data show that every lull in rents has been followed by a higher high in the rent inflation rate.
Since mid 2013, the inflation rate of OER has only caught up with actual rent increases for 2 quarters in 2014 and in the last two quarters. Other than that, OER has typically been 2%-8% below the actual annual rate of increase in market rent.
Home sale price changes reported by the Federal Housing Finance Agency are also shown on the chart above. While the FHFA uses a smoothed, lagged version of reality, their index reasonably reflects what the NAR data has shown in near real time. The FHFA has a lag of 2-3 months. I have input the home sale price data for February and March based on the data from the NAR.
Here again, the OER component of CPI is way below reality. Instead of the housing inflation rate of 6.5%-7% in the real world, the BLS shows a rate of only 3.5% in the BLS’s imaginary world.
This isn’t just a one time thing. It has been going on for decades, since the BLS dropped housing prices from the CPI in 1982. They did it deliberately to suppress CPI because it was costing everybody too much. The Federal Government indexes government benefits and salaries to the CPI. In addition, business was complaining to the Feds because those bad, nasty labor unions were forcing them to incorporate CPI wage increases into their labor contracts. So that was it. The BLS got rid of housing prices in the CPI because they were rising so fast, it was just costing the government and its cronies in business too damn much.
In the years that have followed, the policymakers, and in particular the gang at the Fed, have loved the game of under-counting inflation. They have managed to exclude everything from CPI that’s inflating too fast. So dangerous asset bubbles are allowed to grow and fester as CPI under-measures the real rate of inflation in the economy.
These things have tended to adjust violently from time to time. 9 years of asset inflation is a very long in those terms.
The sand is running out of the hourglass.
Lee first reported in 2002 that Fed actions were driving US stock prices. The US Treasury has also played a role in directly moving markets. Lee has tracked and reported on those relationships for his subscribers for the last 15 years, helping to identify major turning points in the markets in their earliest stages. Try Lee’s groundbreaking reports on the Fed and the Monetary forces that drive market trends for 3 months risk free, with a full money back guarantee. Be in the know. Subscribe now, risk free!

