
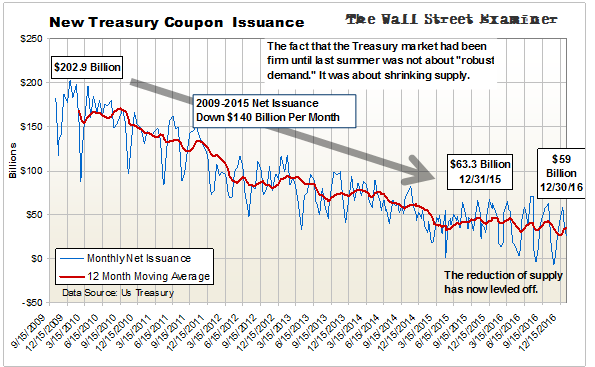
The total issuance data for December shows that the long term decline in Treasury coupon issuance seems to have come to an end. Current net new offerings are barely below the levels of last year. Even before Trump’s spending, any weakening of the economy would cause a need to raise new money by selling more debt.
There’s plenty of reason to believe that the economy is weakening (see Federal Revenues Report). It hasn’t shown up in the withholding tax collections yet, but it has in other key taxes. They are more likely to be leading or concurrent indicators than are withholding taxes. Employers have a habit of being late in recognizing economic slowdowns.
The downtrend in supply would reverse to the upside if the slide in tax collections broadens to include withheld income taxes. Trump’s plans for a massive increase in infrastructure and military spending, which is likely to be rubberstamped by Trump’s Rump Congress, will exacerbate the problem. As supply soars in the face of ongoing weakening demand, Treasury yields will rocket higher.
We are headed for absolute chaos if this scenario plays out.
Here’s a review of how we got here from my reports of the past 2 years.
September 5, 2015:
Shrinking Treasury supply has supported the Treasury market since 2009. Meanwhile excess liquidity with nowhere else to go flowed to stocks. If the trend of shrinking Treasury supply reverses, then an environment which has turned hostile in other ways would turn more hostile for both bonds and stocks.
The proposition that the Treasury market is supported by deep and robust demand isn’t supported by the data that we watch. Demand comes and goes. The fundamental constant for the past 6 years has been shrinking supply. The US economy will weaken as a result of worldwide financial market turmoil. The Federal Budget deficit will grow. The US Government will borrow more. That increase in Treasury supply will hit the market, putting downward pressure on prices (upward on yields).
December 5, 2015:
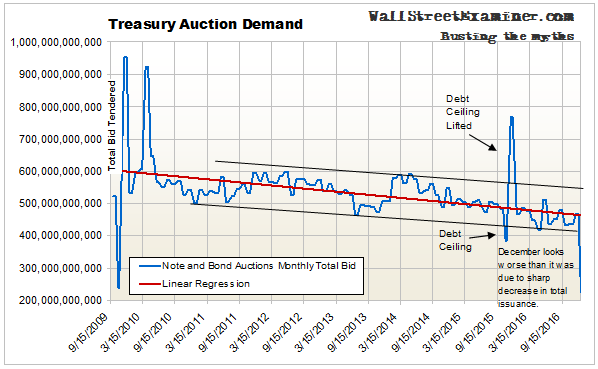
I have compiled the data on coupon auction demand and can now show that demand has also been declining along with supply. The chart below shows the total monthly bid tendered for Treasury note and bond auctions of longer than one year term. The linear regression line shows a decline in demand of approximately 12% since 2009. New supply has dropped by two thirds. Supply has dropped far faster than demand. Therefore, prices have risen and yields have declined. We’ll be on the lookout for any sign that the gap between those curves is beginning to close. That would be bad news for both Treasuries and stocks.
July 20, 2016:
The trend of Treasury supply has been falling since 2009, although at a slower pace since 2014. It reached the lowest levels of the past 7 years in July. Supply will begin to increase if the US economy weakens, causing tax revenues to fall.
Given the long term trend of weakening demand for Treasuries, any increase in supply would be a recipe for falling prices and rising yields.
That brings us to today.
Meanwhile demand for Treasury coupons, as measured by the total bid at each auction remains in a downtrend. December looks like a crash in demand, but it wasn’t. The steep drop was due to the fact that the government sharply reduced total offerings in December, partly by eliminating the usual 2, 5, and 7 year note auctions. Therefore the bid was also much smaller.
However, the fact that demand didn’t actually crash does not mean that demand wasn’t weaker. It was weaker, and by a material degree.
Comparing apples to apples, there were auctions of 3 and 10 year notes and 30 year bonds which we can compare with the November offerings of the same paper. There were significant declines in December. The total bid on those 3 auctions in December was $141 billion. That was down $21 billion from the same three issues in November.
Treasury prices had been falling and yields rising since July (before pausing in the last couple of weeks ). Why?
Here’s what I think is the most important driver of the trend.
In my reviews of the ECB’s monthly bank data we have seen that the European banking system is in dire straits. In the past, European banks and dealers would use the cash they were getting from the ECB QE program to buy US Treasury securities. That appeared to buttress their balance sheets. But things have gotten so bad lately that they’re no longer doing that. Instead, they are using the QE cash to pay down their own debt. They have a long, long way to go to get to a place where their balance sheets are healthy. That’s bad news for the US bond market, and eventually for US stocks as well… eventually.
The bear market in bonds is already under way in my opinion. For stocks, it is still looming over the horizon. S0 the issue, as always, is timing.
That’s the next section of this month’s Wall Street Examiner Pro Trader Treasury Supply and Demand update.
This report is excerpted and modified from Lee Adler’s Wall Street Examiner Pro Trader Monthly Treasury Supply and Demand Report.
Lee first reported in 2002 that Fed actions were driving US stock prices. He has tracked and reported on that relationship for his subscribers ever since. Try Lee’s groundbreaking reports on the Fed and the Monetary forces that drive market trends for 3 months risk free, with a full money back guarantee. Be in the know. Subscribe now, risk free!

