
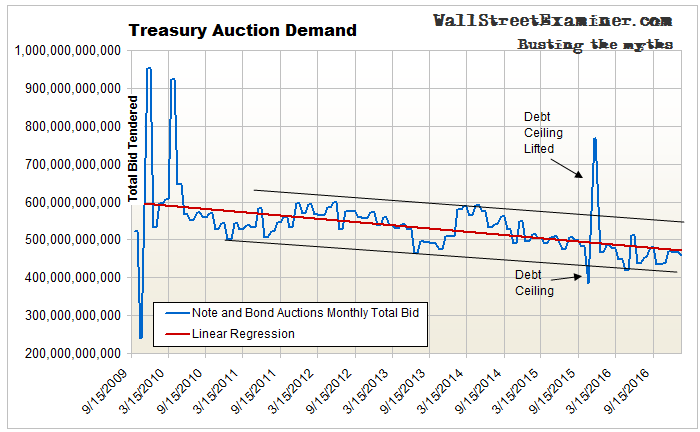
The proposition that the Treasury market is supported by deep and robust demand isn’t supported by the data that we watch. Demand has been in a secular downtrend since 2010. The fundamental constant that has buoyed bond prices and suppressed yields for the past 6 years has been shrinking supply, not strong demand. The total bid tendered at Treasury auctions has been in a steadily declining trend since 2010
In the face of this trend of declining demand, supply isn’t likelier to get friendlier. In fact, it will be a negative force.
Over the past 6 months through January, real time Federal tax data show that the US economy is at least stalled, if not weakening. There’s no reason to expect a change in that trend unless you believe that Congress will pass most of Trump’s stimulus package.
Either way, Treasury supply will rise. If the US economy continues to weaken the Federal Budget deficit will grow as revenues fall, the US Government will borrow more, and that increase in Treasury supply will hit the market, adding to the pressure of shrinking demand. Or if Congress passes the Trump package without raising taxes, spending will grow much faster than revenues. Again, the deficit will grow, and the Treasury will need to raise cash by selling more debt. The supply increase will put downward pressure on prices and upward pressure on yields in the absence of a concomitant increase in demand.
Demand for Treasury coupons, as measured by the total bid at each auction remains in a downtrend. The total bid at the January auctions was $460 billion, down $6 billion from December, and a $10 billion drop from October. This is a secular trend that has persisted since 2010. There’s no evidence, nor any reason to think, that this will change for the foreseeable future.
The new Administration tried a gambit to goose demand in January. The Treasury was sitting on $400 billion in cash at the end of the year. After building that cash hoard for 2 years in preparation for the foreordained coronation of Queen Clinton II, the Obama Gang was shocked to be handing that cash over to the new El Presidente Para La Vida.
The don Don’s financial consigliere Myer Lansky Mnuchin told the Don to use some of the cash dowry presented by the Obama Gang to pay down Treasury debt in January. That would get the markets off to a good start.
By using the cash to pay down Treasury debt, it would accomplish two things that would boost the markets. It would remove paper from the market that the holders would have rolled over. So there would be less supply. At the same time it would put that cash back into the accounts of dealers and investors who were holding the expiring paper that would not be rolled over. This ploy was, in fact, sufficient to keep a bid under the paper and lift prices a bit.
But tellingly, it did not increase total demand! That’s a sign of a real lack of buying interest that can’t be mitigated by temporarily forcing cash into the pockets of bond buyers.
Looking elsewhere, Europe is a big source of Treasury demand. We know from reviewing the ECB’s monthly bank data that the European banking system is in dire straits. It appears that rather than investing in Treasuries, European banks and dealers are applying the cash they are getting from the ECB QE program to reducing their own debt. Some of those banks have a long, long way to go to get to a place where their balance sheets are healthy. That’s another reason that demand for Treasuries is slowly but steadily falling. It’s bad news for the bond market long term, and eventually will be for stocks as well.
The bear market in bonds may already be under way but the market is currently at a major inflection point. The most important factor we can watch in that regard is the behavior of the Primary Dealers.
Primary Dealers increased their Treasury coupon positions as well as Agencies and corporates in the month ended January 25. They cut their holdings of MBS slightly. On the whole, they got much longer than they were in December. Their long positions in Treasuries are now back above the 1 year moving average, which had been broken in January.
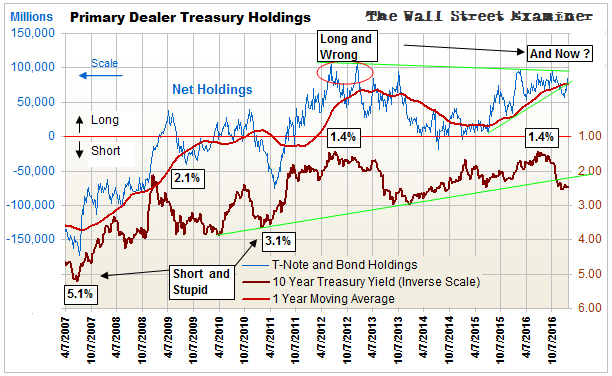
This rebound is a step back from a major inflection point that could signal the death of bonds if dealer long positions had continued to shrink. It also is a step back form a warning that the blowoff in stocks is not long for this world. A breakdown in the bond market led the 1987 stock market crash by 5 months. This time it looked like the bond market was on a similar path. But it has stepped back from the brink, for now at least.
The dealers hedge their cash positions in the futures markets. Dealer positions in Treasury coupon futures of all durations for the week ended January 31, 2017 were net short approximately 667,000 contracts with a face value of $66.7 billion. This compares with a net short of 508,000 contracts with a face value of $49.8 billion the month before.
This was the third straight monthly increase in their net short positions in futures and by far the largest. At the same time as they were adding cash longs.
The value of their long cash positions in T-notes and bonds was $85.6 billion, up from $63 billion 4 weeks before. On balance, considering both the futures and cash positions the dealers were net long cash Treasuries versus futures by approximately $19 billion. That was up from $13 billion net long the month before.
Their net long position peaked at $40 billion at the end of October. That was up from $9 billion in late August. The January net long position of $13 billion was the lowest point in the downswing from October. Now the cycle is moving back up. The question is how far and where the next inflection point is. Looking at the cash chart, $100 billion net long looks like the reversal signal. That would correspond with a combined cash-futures net position of approximately $40-45 billion.
For now, as long as the net position is below $40 billion long, the odds appear to favor higher prices and lower yields for bonds. However, if the dealers’ net position falls below $9 billion long, that should confirm that a secular bear market in bonds is under way. I track this data each month in the Wall Street Examiner Pro Treasury Supply and Demand reports.
This report is derived from Lee Adler’s Wall Street Examiner Pro Trader Monthly Treasury Supply and Demand Report. Click here to subscribe now and try the service risk free for 90 days.
Lee first reported in 2002 that Fed actions were driving US stock prices. He has tracked and reported on that relationship for his subscribers ever since. Try Lee’s groundbreaking reports on the Fed and the Monetary forces that drive market trends for 3 months risk free, with a full money back guarantee. Be in the know. Subscribe now, risk free!

