
The headline, fictional, seasonally adjusted (SA) number of initial unemployment claims for last week came in at 267,000. The Wall Street economist crowd consensus guess was a little too high at 276,000, a non material difference.
We have no interest in the seasonally manipulated headline number expectations game. Instead we focus on the actual trend of the actual data. Facts and reality are much more useful than the Wall Street captured media’s fantasy numbers. Actual claims were 258,119, which is another record low for this calendar week, continuing a nearly uninterrupted string of record lows that began in September 2013.
Employers in some sectors are hoarding workers. Similar behavior in the past has been associated with bubbles, and has led to massive retrenchment, usually within 18 months or so. The current string is now 3 months beyond the point at which other major bubbles have begun to deflate.
In the housing bubble similar behavior continued well beyond the peak of that bubble in 2005-06. Employers seem to take their cues from stock prices.
The Department of Labor (DoL) reports the unmanipulated numbers that state unemployment offices actually count and report to the DoL each week. This week it said, “The advance number of actual initial claims under state programs, unadjusted, totaled 258,119 in the week ending June 13, a decrease of 17,500 (or -6.3 percent) from the previous week. The seasonal factors had expected a decrease of 5,864 (or -2.1 percent) from the previous week. There were 301,195 initial claims in the comparable week in 2014.”

This week of June is a swing week, with claims sometimes up, sometimes down, with a wide variance. There’s no evidence of seasonality. The actual change this week was a decrease of -17,500 (rounded). That compared with a decline of -12,000 for that week last year and the 10 year average for that week of an increase of +12,500 (rounded). Week to week changes are noisy. The trend is what’s important and it remains on track.
Actual claims were 14.3% lower than the same week a year ago. Since 2010 the annual change rate has mostly fluctuated between -5% and -15%. This week’s data was on the strong side of that range. That unusual degree of strength has now been persistent for 2 months. There’s no sign of an uptick in the trend of firings and layoffs.
There were 1,825 claims per million of nonfarm payroll employees in the current week. This was a record low for that week of June, well below the 2007 previous record of 2,136. The 2007 extreme occurred just a few months before the carnage of mass layoffs that was to begin later that year. Employers were still clueless that the bubble had ended and that that would have devastating effects.
Because employers apparently tend to take their cues from stock prices, we cannot depend on this data for advance warning of a decline in stock prices, although there should at least be concurrent confirmation.

I look at an analysis of individual state claims as a kind of advance decline line for confirmation of the trend in the total numbers. The impact of the oil price collapse started to show up in state claims data in the November-January period. While most states show the level of initial claims well below the levels of a year ago, in the oil producing states of Texas, North Dakota, Louisiana, and Oklahoma, claims have been consistently above year ago levels since the turn of the year. North Dakota and Louisiana claims first increased above the year ago level in November of last year. Texas reversed in late January. Oklahoma joined the wake shortly after that.
The data for the June 6 week looks like this:
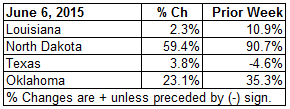
These numbers have varied widely, week to week but the trend of claims being significantly higher than the same week last year has been persistent. Texas, with a huge and somewhat more diversified economy has improved since April as the price of oil rebounded and stabilized, and the state showed a year to year decline in the week ended May 30. But the following week Texas again had more claims than last year.
In the June 6 week, 12 states had more claims than in the same week in 2014. That was down from 15 the prior week, and 13, 4 weeks earlier. This number fluctuates widely week to week with many states near even. At the end of the third quarter of 2014 just 5 states showed an increase in claims year to year. At the end of 2014 that had increased to 8. In early April this year the number had risen to 22. So there has been some moderation in this trend as the oil collapse has leveled off.
The 22 states that were higher in early April gives us a benchmark to watch, similar to an advance decline line in the stock market. If the number of states showing a year to year increase in claims should exceed 22, it should be an indication that the trend is beginning to reverse. That could be an advance warning of a big stock market decline as well.
I track the daily real time Federal Withholding Tax data in the Wall Street Examiner Professional Edition. The year to year growth rate in withholding taxes in real time is now running +5.3% in nominal terms. This is down from +5.8% a month ago, but it’s within the normal range of fluctuation in this data.
The June 12 week was the reference week for the May payrolls survey. The numbers for that week showed a year to year gain of +6.4%, which compares with a year to year gain of +5.4% in the May reference week. This suggests a gain in June payrolls that is even stronger than in May. That would move the Fed closer to attempting a rate increase, especially now that CPI data has begun to catch up to reality. April headline CPI reported last month grossly understated actual inflation. They played catch up with the May number.
The claims data shows that financial engineering bubble economy is still at full boil. This will continue to encourage the Fed to engage in the charade of pretending to raise interest rates sooner rather than later. The real problems will start when the Fed finds that in order to get rates up, and keep them up, it will need to begin shrinking its balance sheet. I cover that subject in depth in your weekly Money-Liquidity Pro reports.

