
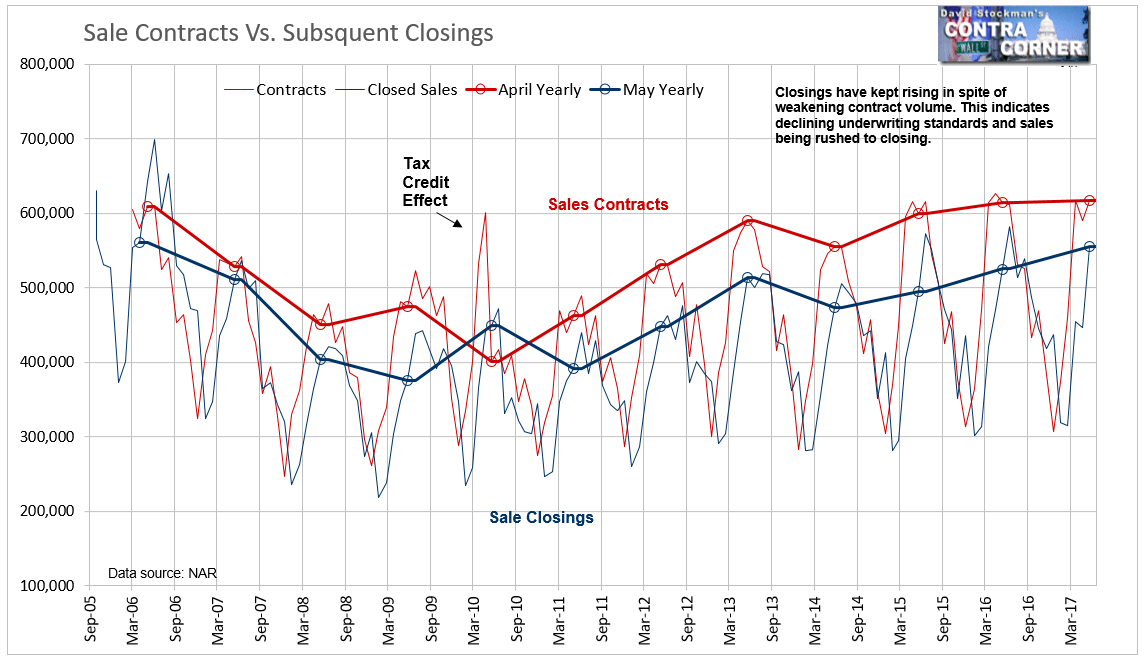
Yesterday we reviewed the data on what the National Association of Realtors (NAR) calls “Existing Home Sales” (EHS) as if that number is a current event and an important data point. In fact EHS reports the number of previous sales contracts on existing homes that went to closing in May. Sales that closed in May typically took place in March and April. Sales normally take place from 4 to 12 weeks before the closing. Around 90% +/- of all sales close. The closing is a formality. Why wait for 3 month old data when we have the data for last month.
The NAR reported that more current data for sales for May on Wednsday. It calls the report of current sales “Pending Home Sales” (PHS). That’s a misnomer. The only thing pending is the closing. The few sales that don’t close usually sell again quickly, most often at the same or even a higher price.
Funny thing is, unlike the NAR, the government recognizes a new home sale when the house, which usually doesn’t yet exist, goes under contract. That is the correct method of gauging the condition of the current market. The NAR, or its marketing arm Realtor.com, a subsidiary of Dow Jones-News Corp, could easily give us real time market data. But they don’t. In this case, the government does it the right way, recognizing the sale when the contract is signed, and reporting it as soon as reasonably possible. The weakness in the government data is that it’s a tiny sample survey that often requires significant revision but the general direction is usually on the button. We’ll look at that data tomorrow.
The NAR/News Corp-Dow Jones does report current sales but calls them “pending.” That was the report issued Wednesday. Ironically, the NAR already reported May sale prices based on May contract data, but they show the report using May closings data rather than the associated sales volume number. It’s mismatched data.
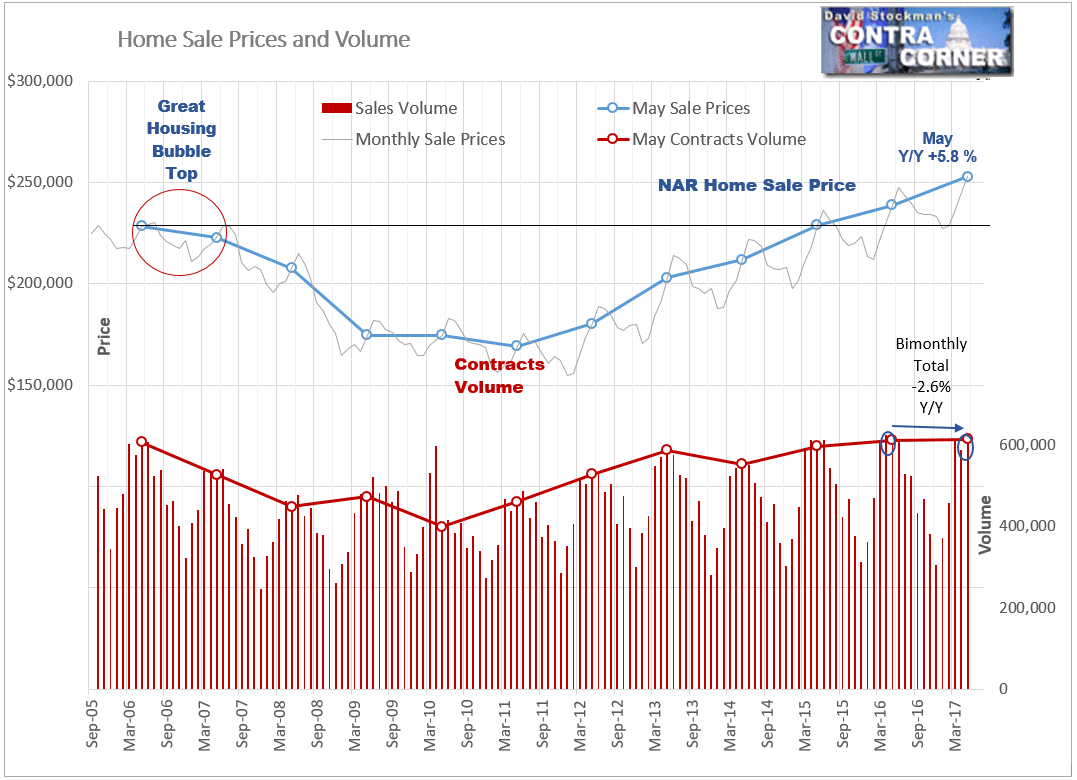
We know this from tracking online broker Redfin.com’s data. Redfin covers all of the biggest, most active US markets, reporting MLS sales and price data from the most recent month with a lag of only 2-3 weeks. The NAR usually reports its PHS data about a week later. The NAR’s price data, while at a slightly lower level because it is broader, moves at exactly the same time and almost the same pace as the Redfin data. The NAR reported a year to year price gain of 5.8% in May. Redfin reported 6.8%. That spread is typical because Redfin’s data covers 44 of the largest US metros and is over weighted with the hottest housing markets. Both data sets are very good at giving a picture of the direction of the market as close to real time as possible.
We showed yesterday that the May EHS substantially overstated the annual gain in sales volume. Actual sales growth was only 0.7% year to year, which was a dramatic slowing from the rate of the past 2 years. Now we know from the PHS that the actual sales in May, from which the May prices were derived, was even worse than that.
May contract volume appeared to rise 0.5% year to year. That’s a radical slowing from a 2.4% gain a year before, and 7.9% two years ago. But the reality is even worse than that, thanks to a calendar anomaly. An unusually low number of business days in April this year ended up leaving a few sales made over the last weekend of the month being entered into MLS databases on Monday, May 1.
We can account for the problem shifting of sales repors from April to May by combining the 2 months. Then we compare that to the same period a year ago. That reveals a decline of 2.6% in April-May sales. These are typically the two busiest months of the year. Therefore it is an extremely important data point.
And it’s not a flash in the pan. This is the 4th straight month of shrinking bimonthly sales. Again we see that the rise in “Existing Home Sales” has been a mirage caused by loosening underwriting standards and acceleration of the contract to closing period. There is no growth whatsoever in actual sales (PHS). Volume has been declining year to year since February.
Mortgage rates have been stable since February, so that’s not the problem. The pundits are blaming a supply shortage for the reduced volume. There appears to be some truth to that. Redfin reports record traffic and record numbers of offers since the start of their data in 2013.
The data shows that supply is at record lows and is dropping. Every day the media is full of reports of bidding wars and houses selling above list as soon as they come on the market. Every other show on HGTV is a house flipper series. It’s sheer panic–buying panic.
Driving that panic is strong price inflation and the well grounded fear of rising mortgage rates. It all sounds familiar. These are the very same market conditions that I witnessed in Florida when I sold my house near the peak of the housing bubble in June 2005. Volume peaked in Florida in October of that year. Sales prices hung around the highs for another year, but volume collapsed. Very few sellers were able to sell at those peak prices. If you did, it was like winning the lottery.
A financial crisis was brewing in 2006, and was already well under way in 2007 when the drop in home prices began. By that time it was too late. The Fed made matters worse when it stopped growing its assets in mid 2007. Prior to that it had maintained a steady growth rate of around 5%.
The Fed was anxious to stop a bubble that had already begun to deflate. The first plumes of smoke from the financial crisis fire were already appearing. The Fed exacerbated the crisis when it elected to shrink its bond holdings in 2007 and 2008. It did so to sterilize the alphabet soup programs it had begun to issue in late 2007 to try to bail out the banks, the money market funds, the commercial paper market, and the Primary Dealers.
The Fed had inadvertently starved the dealers of cash when it stopped buying bonds from them at the same time as the Treasury was issuing hundreds of billions in bonds to fund the TARP. That turned into a catastrophe, which became the Fed’s motivation for QE. It felt that it had no choice but to rescue the Primary Dealers, lest all of those Fed clients lose their yachts. The initiation of QE in turn fueled the financial asset inflation, which is finally coming to a close. Once again, because the Fed has decided that it can no longer tolerate the asset bubble it created. It has created a monster that the Fed thinks it now must, and can, control.
Just as in 2007, the Fed, worried about asset bubbles, is planning to shrink its balance sheet. As usual its timing is terrible. It is too late.
Whether for reasons of restricted supply or weakening of effective demand, sales volume in housing has already peaked. When the Fed shrinks its balance sheet now, mortgage rates will rise. The fact that the Fed has been subsidizing buyers’ mortgage payments with record low mortgage rates since 2013 is the primary reason there are any buyers at all at these prices.
As the Fed removes money from the system, that subsidy will shrink and there will be fewer buyers at current prices. Sales volume will begin to shrink faster. Prices will collapse. It will happen once sellers realize that there are no more buyers. The apparent absence of supply that we see today will suddenly become a glut.
That’s what happened in 2007. I remember the pundits saying in 2005 and 2006 that the market was healthy because demand was strong and supply was tight. How quickly that reversed, and how devastating the consequences were.

