
“
Yesterday, I discussed the importance of risk management and reviewed the 15-rules that drive my portfolio management discipline. I needed to lay that groundwork for today’s discussion of why those rules need to be implemented right now.
As shown in the chart below, the market has currently surged nearly 9% from the “Brexit” fear lows driven by a massive increase in Central Bank interventions.
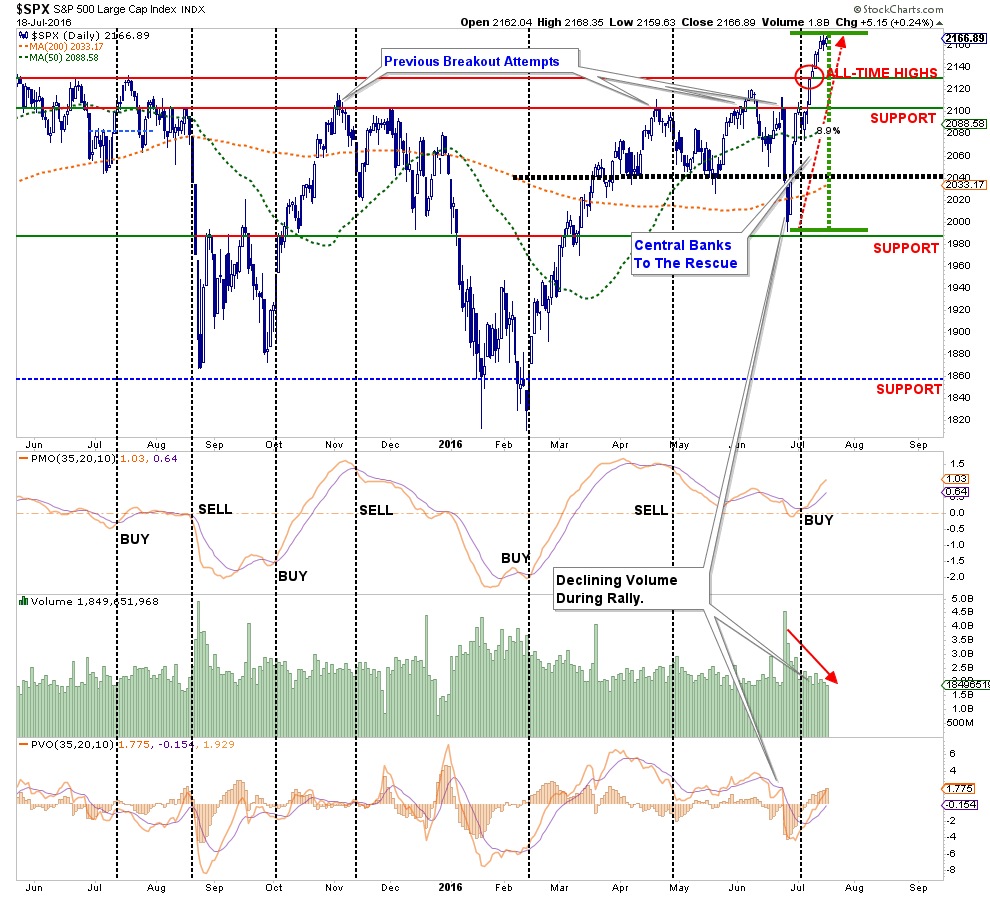
The problem, as I have pointed out previously, continues to be that while prices are increasing, that increase in price is coming at the expense of declining volume. While volume is not a great timing indicator for trading purposes, it does provide insight to the “conviction” of participants to the advance of the market.
But do not be mistaken about the importance of the drivers behind the advance. As Doug Kass recently penned:
“Global economic growth’s weak trajectory and Washington’s stark partisanship have combined to produce fiscal inertia. This puts the responsibility for stimulus on central banks, which have in many cases taken interest rates into negative territory. This has disadvantaged savers and put investors and traders on an arguably dangerous path of malinvestment in a search for yield.“
The current market extension has currently extremes which are more normally associated with short to intermediate term-corrections. As shown in the next chart, on a daily basis the market is pushing 3-standard deviations of its 50-dma moving average.
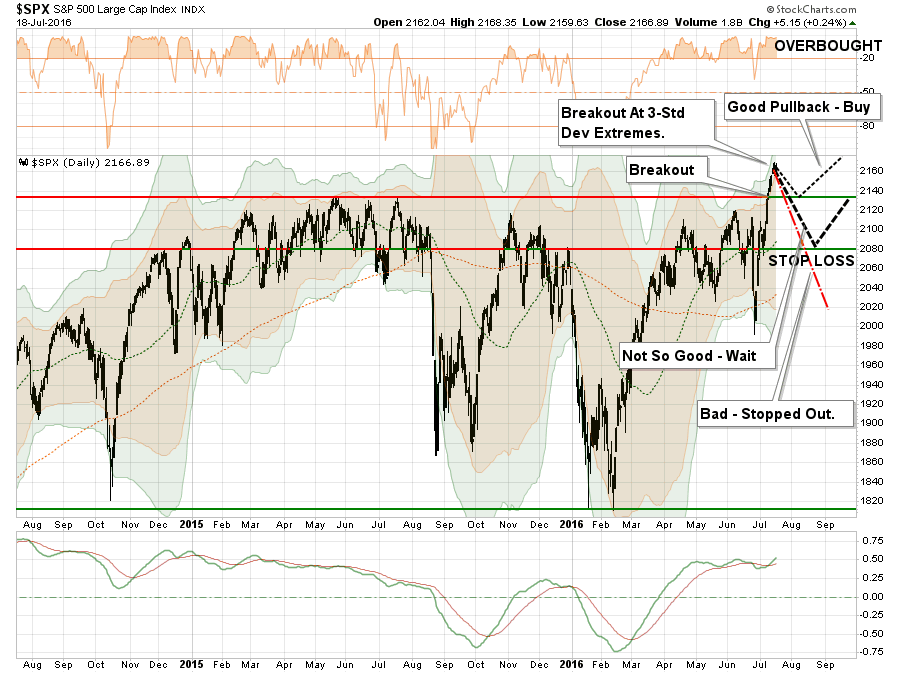
Like stretching a “rubber band” as far as you can in one direction, the band must be relaxed before it can be stretched again.
However, as noted in the chart above, there is a difference in pullbacks.
- A pullback to 2135, the previous all-time high, that holds that level will allow for an increase in equity allocations to the new targets.
- A pullback that breaks 2135 will keep equity allocation increases on “HOLD” until support has been tested.
- A pullback that breaks 2080 will trigger “stop losses” in portfolios and confirm the recent breakout was a short-term “head fake.”
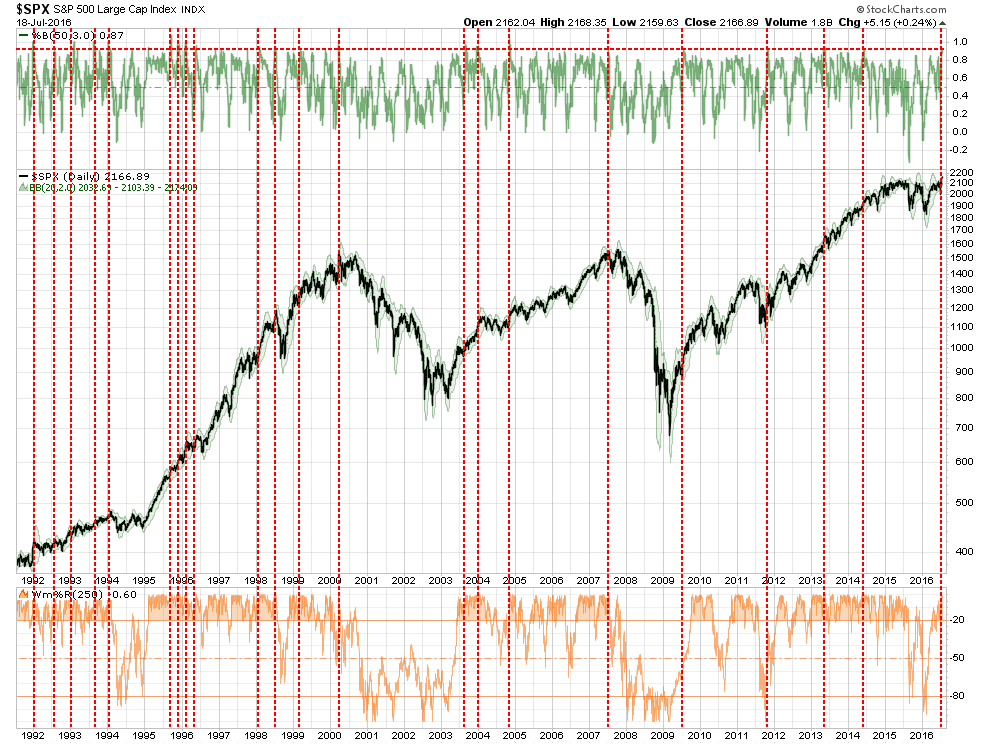
The magnitude of the current extension of the market above its 50-day moving average can be seen if put into context of a long market cycle. The chart below shows the number of times the market has reached 3-standard deviations of the 50-dma. In the vast majority of cases, it was not long until the market experienced a pullback, correction or worse.
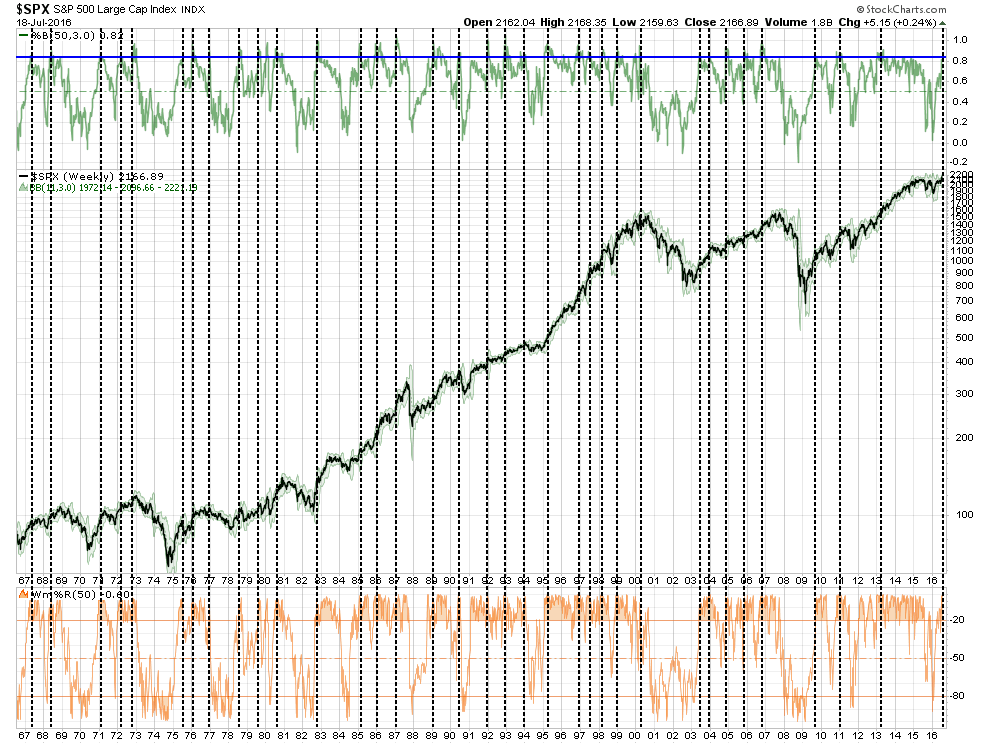
We can see the same idea by slowing down the price action from daily to weekly. While there are fewer occurrences, the importance of extreme extensions becomes clearer.
Of course, at the same time market prices have advanced sharply higher, the “fear of a correction” by investors, as measured by the volatility index, has dropped sharply lower. Again, as with extreme extensions, sharp drops in volatility have been historically associated with near-term peaks, and potential starts of deeper corrections.
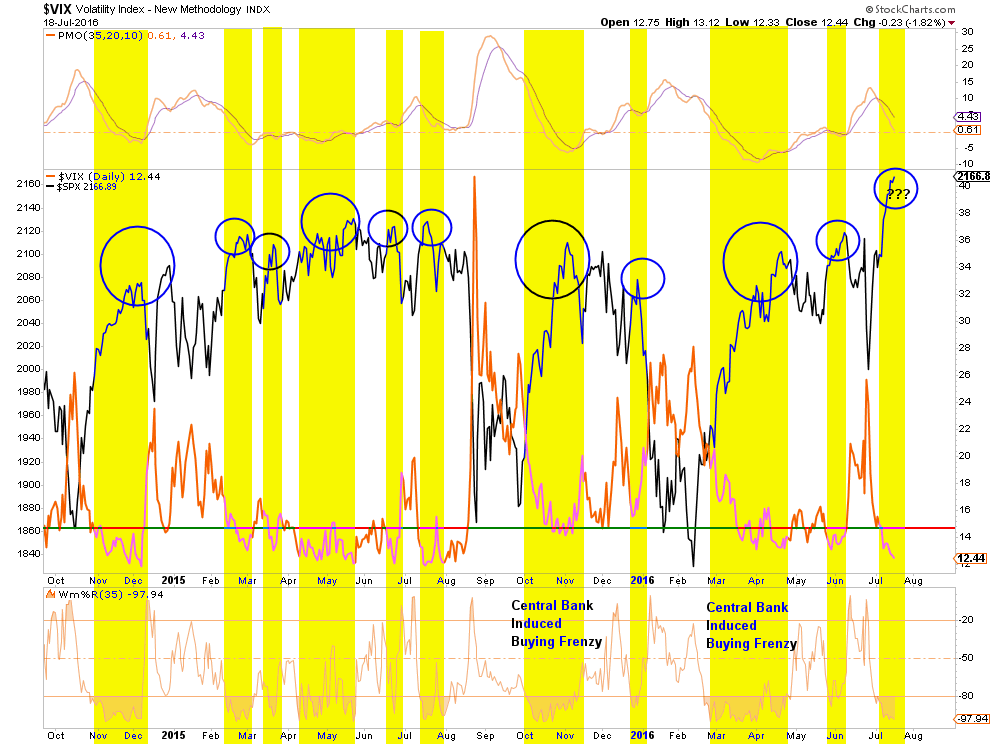
Doug noted the same:
“Stocks continue to defy all odds and reject untoward events of almost any kind, but I remain wary. It’s true that stocks and bonds’ recent relentless climb has calmed most investors — making them far less fearful of a possible major downturn (what I call the Bull Market in Complacency).”
What is clear is the risk of at least a short-term correction is near. For many individuals, the recent parabolic advance has bailed them out from what could have been a more painful correction had Central Banks not bailed out the markets once again. Therefore, it is prudent to use this recovery to clean up portfolios and rebalance risk accordingly. These actions would include:
- Tightening up stop-loss levels to current support levels for each position.
- Hedging portfolios against major market declines.
- Taking profits in positions that have been big winners
- Selling laggards and losers
- Raising cash and rebalancing portfolios to target weightings.
There is no rule that states that you MUST be fully exposed to the markets at all times. This is the equivalent of betting “all in” on every hand in poker. You may think you are getting wealthy while your “hand is hot” but you are eventually guaranteed to poorer than when you started.
This market is no different currently, and the “hot hand” being dealt has gotten investors once again over confident in their own abilities. This tends to end badly more often than not.
Anthony Mirhaydari nailed this point yesterday:
“Bond investors — and by extension, stock market investors — should be feeling very, very nervous. The global financial system is incredibly complex and increasingly threadbare. And a surge in central bank asset purchases to levels not seen since 2013, combined with hopes of even more purchases, has helped push stocks to fresh highs.
But stocks are incredibly vulnerable. Only 28 stocks in the S&P 500 (less than 6 percent of the index) are at new highs. Less than 72 percent of the stocks in the S&P 500 are even in uptrends.
Any hiccup, from a reversal in the yen; a backup in rates; indications that the Fed is sticking to its two-quarter-point rate hike forecast for 2016; disappointment in the BoJ; realization that valuations and earnings are a problem; a return of geopolitical fears; a continuation of recent energy price weakness (with U.S. oil rig counts growing at the fastest pace since 2011); or even a realization that anti-establishment/anti-globalization candidate Donald Trump has risen in some polls (especially in critical swing states) against global elitist/status quo candidate Hillary Clinton could quickly reverse the gains we’ve seen over the last three weeks.
You know the old adage: Stocks take the stairs up but the elevator down. With everything so expensive, the bull market among the oldest in history, and risks multiplying as fundamentals fade, caution is a virtue here.“
I agree. Taking in some profits from the recent advance will likely look smart sooner rather than later.
But that is just my “Thoughts From The Beach (TFTB)” for today.
Lance Roberts
Lance Roberts is a Chief Portfolio Strategist/Economist for Clarity Financial. He is also the host of “The Lance Roberts Show” and Chief Editor of the “Real Investment Advice” website and author of “Real Investment Daily” blog and “Real Investment Report“. Follow Lance on Facebook, Twitter, and Linked-In

