
There’s so much fascinating data buried deep in the bowels of the housing starts data that it’s hard to know where to start. I guess we could start with, “It stinks.” But that would lack the nuance inherent in any unbiased review. Unlike the mainstream media, which likes to put a positive spin on everything, here we tell it like it is.
Our favorite whipping boy, the Wall Street Journal, did not tell it like it is. There’s nothing new there, as their efforts at real journalism have become increasingly few and far between. In fact, today the Journal announced that it is offering a buyout to ALL JOURNALISTS in its newsroom. It looks like the Journal will be dropping any pretense at objectivity and going straight for the direct marketing, which is their real business, as I revealed in Friday’s report.
In its report on housing starts, the Journal went right to the seasonally adjusted fiction and stayed there, once again not bothering to examine or report, the actual, unmanipulated numbers. The Journal headlined that “U.S. Housing Starts Fell 9% in September,” but noted that “Building permits for privately owned housing units rose 6.3%.”
Actual September single family starts rose 1.9% from August, and were up 4.6% year to year. The month to month change was a bit better than average for September, which usually sees a small decline from September. The year to year change was in the middle of the growth rate range of the past 6 months. There’s no sign of a change to the slow growth trend here.
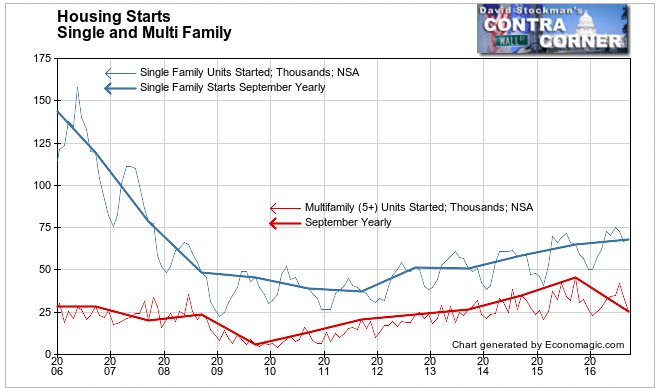
Single family and multi family are very different markets. Single family is normally about 70% of the residential development market. Multifamily is different because the vast majority of multifamily construction is for the rental market, not the ownership market. It makes little sense to combine the figures from the two sectors. One of them can be in a slow or no growth environment and the other can be booming. However when one turns aggressively lower, the other typically follows. For that reason, the collapse in multifamily in September demands our attention.
Multifamily starts fell 8.6% month to month in September. That’s the worst September decline since the early days of the housing crash in 2007. Year to year, multifamily starts fell 44.2%. They are now at their lowest level since 2012 and the trend shows no sign of turning back up. The bloom is off the multifamily boom.
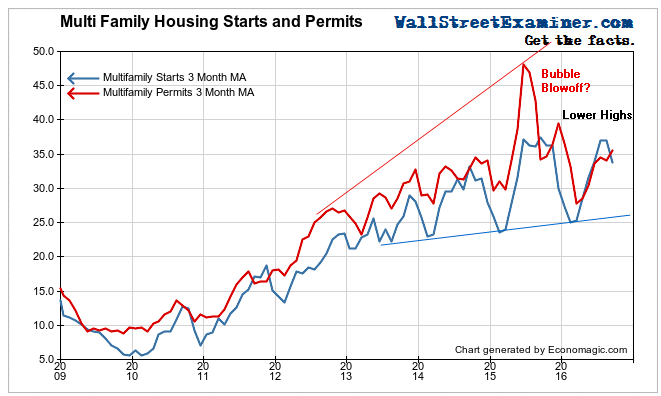
The Journal noted hopefully that multifamily permits rose. Pulling permits is an act of faith. It may or may not translate into concrete action. It usually does, but not always. When development is booming, builders tend to become overly optimistic, pulling far more permits than the ultimately will need to meet demand.
Permits don’t immediately die however. Depending on the locale, they are usually valid for 6 months, after which they expire. Permit pulling had a massive blowoff in mid 2015. Multi unit starts were already at a long term record level and did not follow. There was a second surge of permits toward the end of the year. Again, starts did not follow. There was a seasonal surge in starts in the second quarter of 2016, but that surged topped out below the 2015 peak. The seasonal cyclical patterns of both permits and starts are increasing in amplitude, suggesting increasing instability in the market. It’s too early to conclude that the trend has reversed, but there is reason to be worried that a downturn is imminent.
Just as affordability has begun to put the breaks on the single family market, it may be an even bigger problem in the rental market. Rents have been soaring, prompting developers to pour an ocean of new supply on the market. This is a classic case of supply rising to meet demand as prices rise. Recent reports from the multifamily industry indicate that vacancy rates are rising an that rent growth has slowed to a crawl as tenants can increasingly no longer pay the freight because ‘The rent is too damn high!” Jimmy McMillan, can we hear you now?
The ratio of median asking rent to median household income in 2015 rose to the highest point since the Census Bureau began to collect the median rent data in 1988. That includes a ridiculously overstated estimate of household income in 2015, which we’ve addressed previously in these reports. We also know that personal income growth has again been slow in 2016. Meanwhile rents continued their uptrend through mid year, although at a slower pace.
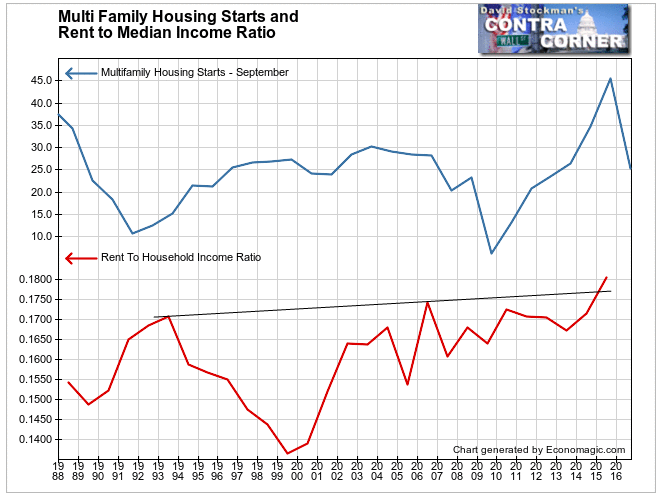
Considering these factors, the ratio of median rent as a percentage of median US household income is now off the chart. It can’t be sustained. The conditions are perfect for a rout in the multifamily housing market. That would hit the financial system hard if it happens. The Fed says that there is $1.14 trillion in multifamily mortgage debt outstanding. If the newer loans go under water, and rents decline, enough foreclosures could hit the market to cause a cascading systemic crash.
These are just a few of the nuggets of information we can extract from the housing starts data. I will mine a few more from the single family starts data in a subsequent report.
Lee Adler first reported in 2002 that Fed actions were driving US stock prices. He has tracked and reported on that relationship for his subscribers ever since. Try Lee’s groundbreaking reports on the Fed and the forces that drive Macro Liquidity for 3 months risk free, with a full money back guarantee.

