
The Commerce Department reported today that sales of newly built homes posted a seasonally adjusted month to month increase of 3.1% to an annualized rate of 593,000. The department revised the August headline number down by 5.6% from 609,000 to 575,000. Without that revision the headline number this month would have been down by 2.7%. Surprise, surprise. Revise, revise.
Meanwhile, this month’s first guesstimate missed the consensus estimate. Economists had guessed 610,000. Bad guess. I bet they weren’t expecting that downward revision either.
The Commerce Department reported that the September headline number was up 29.8% year to year, plus or minus 23.4%. Wow. Nice margin of error.
So much for the seasonally adjusted follies. I have ranted enough about seasonally adjusted data recently so we’ll lay off that bugaboo for a while.
The actual, unmanipulated figures showed 46,000 new homes sold in September compared with 47,000 in August, a drop of -2.1%. That’s a little better than the 10 year average September change of -5.2% and much better than the drop of -14.6% in September of last year. September rebounded from the August disaster of a drop of -14.5%. This looks like calendar gymnastics. Overall the 2 month change of a drop of 9000 units was identical to the performance of August-September 2015.
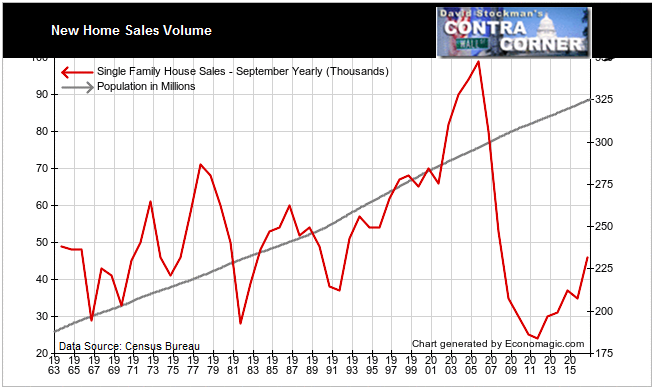
The year to year change was huge, jumping by 31.4%. That sounds great if you ignore how depressed total sales are on a long term basis. Sales have only reached levels seen in the first stage of recovery from the 1991-92 recession. They have yet to reach the 2008 level in the heart of the housing bubble crash.
At the same time, these huge percentage gains could be a sign of the blowoff phase of a bubble. Conditions always look great before the top, but it’s not really always sunny in Philadelphia either. That’s just a TV show. As good as the city looks on a sunny day, there are a lot of dead and buried people here who never see the sun.
Except on election day.
Meanwhile, total September sales are barely above the level of the 1992 recession. It may appear to be in a normal range excluding the massive housing bubble from 2001 to 2006. However, it does not take into account the 75% increase in population since this data was first collected in 1963.
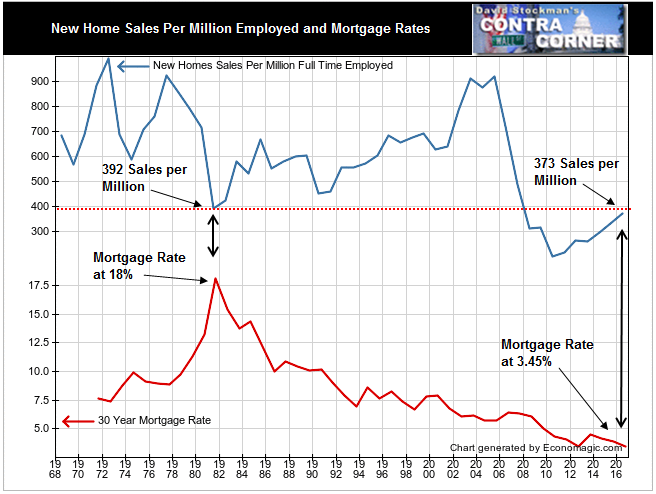
In theory, new home sales should be related to employment growth. But sales aren’t growing with population. On the basis of sales per million full time workers, sales are only back to 373 sales per million full time workers, below the level they fell to at the bottom of the 1981-82 recession. At that time, mortgage rates were at 18%. Today, they are at 3.46%.
The median sale price in September was $313,500, up from $293,800, a gain of 1.9% year to year. This came after a year to year decline in August of –2.1%. That was the worst August performance since 2011, the last year that the government inflated prices earlier in the year with the homebuyer subsidy. Prices fell then after the homebuyers subsidy that had boosted prices was removed.
The September increase was still on the slow side relative to recent years. New home price inflation is near stall speed. The upside momentum of that inflation looks broken. The bubble could be topping out as the affordability problem begins to bite.
Professor Irving Fisher said that mortgage mortgage rates have reached a permanently low plateau. But his equally famous economist brother from another father, Fed Vice Chairman Eddie Fischer, is starting to sing a different tune. There have been lonely teardrops from other Fed hawks in the past, but they walked along. As Vice Chairman, he’ll never walk alone. Other Fedheads are joining the Halleujah Amen chorus.
So just when weak income growth and high prices are combining to cut into demand, the Fed is preparing to let mortgage rates rise. It is the Fed’s manifest destiny to always get policy timing wrong. Always. This time they have boxed themselves in with rates too low for too long. There’s no longer any way for them to get this right.
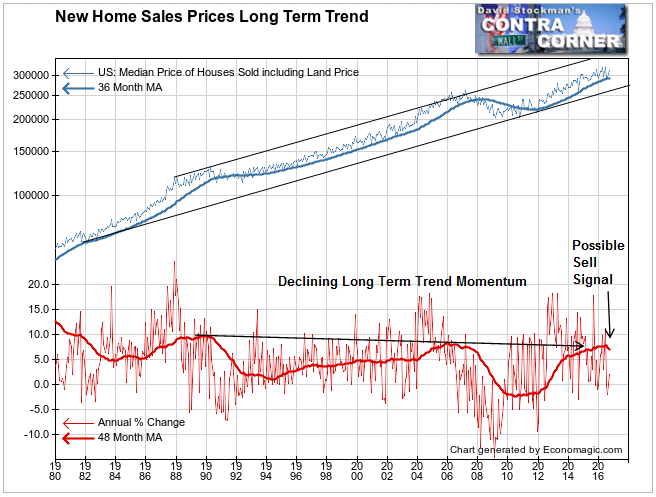
Another sign of a possible top is the weakening in long term upside momentum in the house price trend. The housing inflation rate has been weakening for decades. Prices are still inflating, but they are doing so at a slower rate as wage and salary increases were increasingly limited. Early this year the 4 year moving average of the annual rate of change in prices reached a 27 year trendline, suggesting that the current cycle has reached peak momentum. It then downticked. This looks much like the setup in 2006, just before the market collapsed.
One month does not a trend make. The Fed mortgage payment subsidy probably holds the key to whether this is the beginning of the end. The 10 year Treasury yield has risen by roughly 40 basis points since bottoming in July but mortgage rates have hardly budged as the margin to the underlying index has compressed. We should keep a close eye on the 10 year Treasury yield. 1.80 is a critical inflection point. If the 10 year yield clears that area, mortgage rates could pop suddenly, bringing the new home market to a screeching halt. I’ll take a more in-depth look at that in the next update of the Wall Street Examiner Pro Trader Treasury update. http://wallstreetexaminer.com/category/professional-edition-3/money-and-the-fed/us-treasuries-supply-and-demand/
As mortgage interest declined, buyers could afford to borrow more. But this has its limits as prices have been rising faster than rates are falling. The US homeownership rate has been declining persistently as a result. A tipping point will be reached where new home demand will begin to decline outright. Sales volume will shrink rapidly, and the market will seize up. In a frozen market, nobody gets their price. A downward cascade in prices follows that. In the last financial crash, the decline in sales volume led the way. It hasn’t happened yet here, but the conditions are building.
The recent surge in new home sales suggests that maybe the next crash isn’t imminent. The Fed and other central banks are walking a tightrope however, and the winds over the canyon are beginning to stir. When a bunch of clowns do a tightrope walk over a stormy canyon, it doesn’t end well. That end may not be imminent, but it is inevitable.

