
The Wall Street Journal reported today that:
U.S. Home-Builder Confidence Hits Near-Decade High
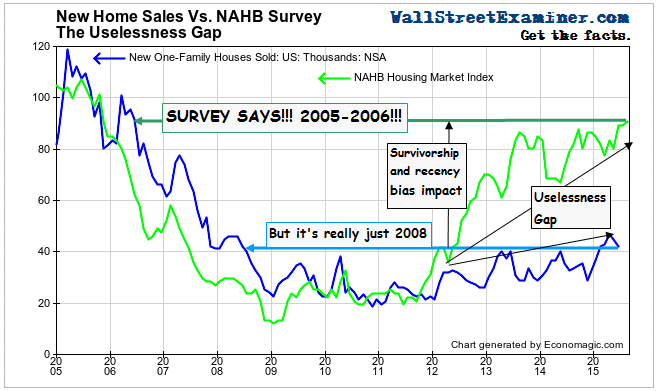
“An index of builder confidence in the market for new single-family homes rose one point to a seasonally adjusted level of 61 in August, the National Association of Home Builders said Monday. A reading over 50 means most builders generally see conditions as positive.”
Happy days are here again.
But here’s the thing. Comparing the index today to 2005 and 2006 is a meaningless and misleading exercise. The data is useless for historical comparisons because it is massively skewed by survivorship bias and recency bias. Many of the builders who were surveyed in 2005 did not survive the crash. The few who did have much larger slices of a much smaller pie. Those bigger slices look pretty good to them, especially considering that they too almost starved between 2008 and 2012. But in reality, sales are only back to 2008 levels, when the crash was in full swing.
Click to view chart if reading in email
Wikipedia has a nice discussion of survivorship bias which goes directly to this point.
Survivorship bias is the logical error of concentrating on the people or things that “survived” some process and inadvertently overlooking those that did not because of their lack of visibility. This can lead to false conclusions in several different ways. The survivors may be actual people, as in a medical study, or could be companies or research subjects or applicants for a job, or anything that must make it past some selection process to be considered further.
Survivorship bias can lead to overly optimistic beliefs because failures are ignored, such as when companies that no longer exist are excluded from analyses of financial performance.
This along with recency bias helps to explain what’s going on with the NAHB Housing Market Index (HMI). Recency bias is our propensity to focus on the recent past as our basis for conclusions about the future. In terms of those two cognitive biases any slight improvement at all is an improvement over the catastrophe of the bottom of the housing crash.
The survey questions ask builders, in essence, “How’s business.” Relative to recent years, builders are able to say its good, because of the fact that while the pie is smaller, they get bigger slices, and that relative to the recent past, the trend has been upward.
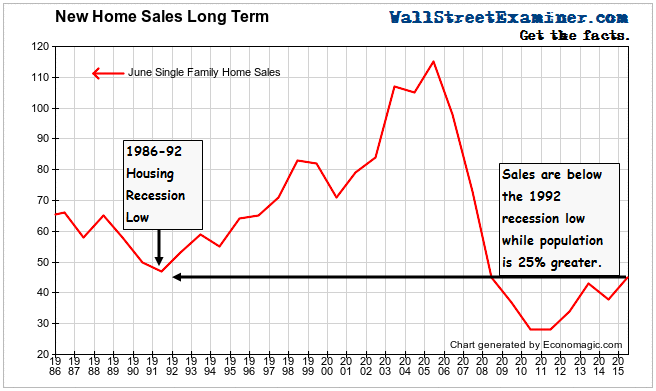
But relative to the long term, the current numbers are horrible. What’s left of the single family housing market may be ok for the surviving builders, but its contribution to the US economy is negligible. It’s not even back to the level of the 1991 recession low even though US population is 25% greater today than it was then. While sales are better than they were at the bottom of the crash, these are still depression levels of activity. When Big Media talks about the housing “recovery” they don’t bother to mention that.
Click to view chart if reading in email
We also know that what growth there has been has been confined mostly to the Southeastern US, particularly Florida, as retirees continue to migrate there. There’s no sign of a broad demographic trend of increasing in home sales. Older people are selling existing homes to buy retirement homes in the sunbelt. Since most builders are mostly active in regions where that’s happening, to them the sky is blue everywhere. In places like the Northeast, where the new single family home market is dead, only a tiny handful of national builders who have long dominated that area, are active. In other words, outside of Toll Brothers, who is building in the Northeast?
Here’s something else that I think that you will find strange–the survey methodology. The NAHB combines 3 separate survey measures into a single index which they refer to as the Housing Market Index, and Big Media calls a measure of “builder confidence.” The 3 questions are how are current market conditions (good, fair, or poor), how will they be in the next six months (good, fair, or poor), as if they have crystal balls, and how is model home prospective buyer traffic (high, very high, low, very low). I’m not sure how combining those into a single index measures “confidence” or even what “confidence” means in this regard. Does it mean that they’re confident business will grow, or maybe only that they’ll still be in business next month?
The 3 “confidence” component readings in July were:
Present Market Conditions: 66
Next Six Months: 70
Traffic of Prospective Buyers: 45
Readings above 50 are positive and below that are negative.
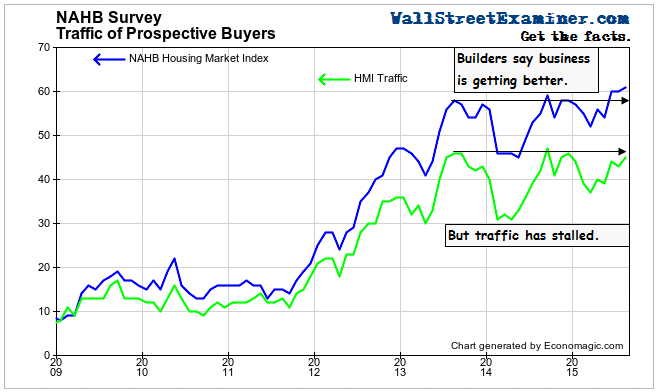
To my way of thinking as a former commercial real estate appraiser who did his share of residential development analysis, the only measure that would have some validity in predicting the trend is the traffic measure. While the present conditions and next six month expectations responses hit new recovery highs, the traffic question did not. Traffic was rated equal to or better than the current number in 6 of the past 24 months.
How does a downbeat reading of 45 for current foot traffic translate to the expectation of a 70 for sales in the next six months? Buyer traffic is bad, but the survey respondents expect boffo business this fall and winter? Are these people delusional, or are they spoofing the survey? Having frequently interacted with homebuilder staffs, I would choose answer B, but I’ll let you be the judge. In any case, it’s illogical.
Click to view chart if reading in email
There’s just a bit of inconsistency in arriving at a 70 reading for future expectations when traffic is 45. And I have no clue what the rationale is for including all 3 measures in a composite index. The composite hits a record while buyer traffic is weak? That just seems silly, but that’s where Big Media focuses its reporting.
For the big builders who remain in the game and are in the right locations, the trend is fine, and it will stay that way until mortgage rates rise enough to pinch off the pitiful level of demand that remains since the crash. If you want to place your long bets there, be my guest.
But for the purposes of understanding the impact of the housing market on the US economy, I’ll stay focused on the actual sales data and leave what the survey says to Family Feud.
Do you believe that liquidity moves markets?
The post Here Are Three Big Reasons You Should Feud With The NAHB Homebuilders Housing Market Index appeared first on The Wall Street Examiner. Follow the money! See and understand the liquidity flowing from the Fed, Treasury, and other major central banks and primary dealers as they impact markets in the Wall Street Examiner Professional Edition.

