
The Commerce Department reported another miracle on Friday. Or rather a mirage. In September, new home sales edged up 0.2% from August to a seasonally adjusted annual rate of 467,000 units. This isn’t a huge number, compared to the crazy days of Housing Bubble 1, but it was a 6-year high! And the media went gaga over it.
So, new home sales in August were initially reported to have been 504,000. Also a 6-year high or something. But these numbers have elephantine margins of error. Big revisions are common. And on Friday, the Commerce Department chopped that number down to 466,000 – which September beat by a barely visible 1,000 units.
In raw, not-seasonally adjusted numbers, 38,000 new homes were sold in September. That was well above September 2013 but still puny compared to the historical sales range of 40,000 to 80,000 units per month, which soared to over 110,000 per month during Housing Bubble 1 (great multi-decade chart by The Wall Street Examiner).
There was another number in this report, the median price at which new homes sold in September: $259,000. And it’s one heck of an ugly dude.
Normally the median new home price rises from August to September. Over the last 7 years through 2013, it fell only once: in September 2011, it inched down $2,600 from August to $217,000. During the remaining 6 years, median prices rose in September – even in 2008, the year when everything related to home sales was swooning. And last year in September, the median home price jumped $14,500 to $269,800.
So that’s sort of what should have happened this September … some kind of uptick. Even a small one would have done. But no. The median price plummeted 9.4% from August. A one-month trip from $286,000 to $259,000. It crashed $27,000 in one fell swoop.
Here is what that plunge looks like (courtesy of the St. Louis Fed). I called it “one heck of an ugly dude” for a reason:
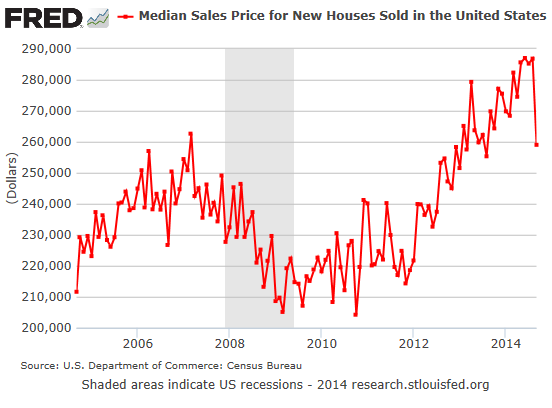
That median price of $259,000 was $10,800 below September a year ago. It was the first year-over-year decline since 2011!
Median home prices peaked in June at $287,000 and in August at $286,800. And that peak in prices, dropping sales volume, and rising inventories coagulated into a toxic mix that finally jarred homebuilders into discount mode. And what industry promoters spend their lives telling everyone that it won’t happen, happened again: after nearly three years of wild year-over-year price run-ups, prices suddenly dropped.
That $27,000 plunge is nothing to sneeze at. In dollar terms, it’s the worst month-to-month plunge EVER.
By comparison, the erstwhile record dollar plunge – and now the second worst – occurred in October 2010. It knocked the median price down by $23,800 to $204,100. In percentage terms, it was a 10.4% hit. The final paroxysm of a housing crash that had lasted over three years.
But this time, the plunge came off the peak. In that respect, it resembles what happened after the median price for new homes had peaked last time, at the phenomenal level of $262,600. That was in March 2007. In April, it crashed $20,100. It was the beginning of the great housing bust.
But not even during the worst month of the housing crash did the median price of new homes plunge $27,000. And that plunge doesn’t even include the costs of the incentives – the granite countertops and Jacuzzi bathtubs – that homebuilders throw in for free in order to close a deal without having to cut the price any further.
Homebuilders know that the market has curdled and that they have to do whatever it takes to make a deal. Homeowners are little slower. When they need to sell, they like to hang on to their illusory gains from prior years. But buyers cannot afford to buy at these prices, or they refuse to, and sales stall. That’s what we have seen for the past year.
All major indices have for months shown that, as sales of existing homes dropped, prices slowed their rise, but they were still rising, if more slowly, and industry promoters spoke of “more sustainable gains,” because they can never imagine an actual drop in prices. But Housing Bubble 2 has been running out of steam [US Home Prices Are Rolling Over (in one Chart)].
We’re seeing the next step in the process. New homes have already been hit. Now it’s spreading to existing homes. On Monday, nationwide real estate broker Redfin released the results of a survey conducted in early October. It starts like this:
Over the past few months, sellers have gotten the message that the market is no longer skewed in their favor…. [T]he belief that now is a good time to sell dropped by 17 percentage points from last quarter. Sellers last quarter told us they planned to price their homes aggressively, but it turned out that most buyers were unwilling to pay above market price. And Redfin agents across the nation started reporting surges in price drops in the first portion of the third quarter.
“Surges in price drops!” Not very promising.
There will be noise, ups and downs, confusion, denials. The industry has been through this before. And the median price of new homes will bounce. Just looking at the chart, I know it will. Because nothing goes to heck in a straight line. But bubbles do only one thing when they end: they pop.
In the US more than in most other countries, it all boils down to consumers because the economy is so dependent on them. Read… The High Price of Free Money: Now US Bankers Fear Financial, Social, or Political ‘Instab

