
Janet Yellen’s favorite labor market indicator the JOLTS survey showed record job openings and hires in July but the ratio of hires to job openings continued to fall to new record lows. The plunge in this ratio is a metaphor for the maladjustment and distortion which ZIRP and QE induced in the labor market by incentivizing useless speculation and stock buybacks, along with constant cuts versus real investment in the labor force. Job openings are growing because employers can’t find workers to fill the jobs they are offering. Either workers don’t have the skills employers need, or the jobs are so menial and low paying that there are few takers.
I first wrote about this over a year ago:
… in spite of skyrocketing job openings, those jobs are not the kinds of jobs that real people, with their existing levels of skills, can fill, nor can they ever fill. There just aren’t that many rocket scientists and financial engineers available in the work force. Yes, that’s sarcasm. The biggest increase in openings has been in low paid restaurant and hotel jobs, which is just as much a problem. The US economy is beset with a huge, multi directional skills mismatch.”
So the growing number of job openings is not a good thing.
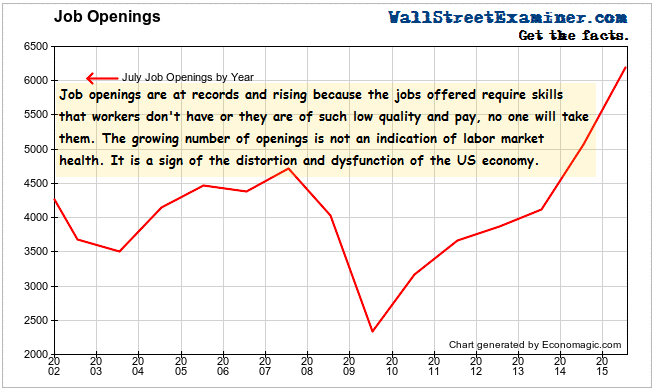
Contrary to the conventional wisdom, the rise in job openings is not bullish. An increase in the number of openings of menial, low paying jobs is meaningless. Jobs that can’t be filled because they require skills that can’t be supplied by the those in the workforce are meaningless. Job openings will continue to grow and the ratio of hires to openings will continue to fall endlessly under these conditions. The vast majority of jobs being offered can’t be filled and won’t be filled. We are counting an illusion.
So the ratio of hires to openings just keeps falling.
Also included in this survey is the number of layoffs and firings.
I plotted the number of layoffs on an actual, not seasonally adjusted, 12 month average versus stock prices.
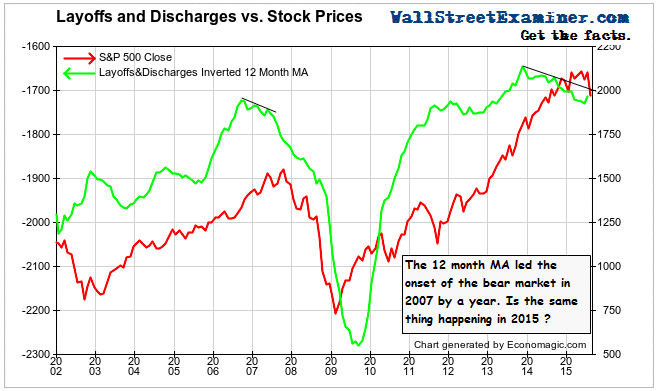
Layoffs fell from from 1.74 million in July of last year to 1.54 million in July of this year. That’s positive, but it looks like a one trick pony. Prior to July, every month since October 2014 has had more layoffs than the corresponding month a year before. The uptick in July did not reverse the trend. The 12 month MA is still in a negative trend.
A similar negative divergence between layoffs and stock prices appeared a year before the last bear market began in 2007. 2015 could see a repeat performance of layoffs as a leading indicator for a bear market.

