
I developed a Composite Macro Liquidity Indicator some years ago as a way of combining various measures of bank deposits, bank investments and trading activity, foreign central banks and Fed liquidity provision. For the past 8 years, the performance of the US stock market has closely tracked this indicator of composite liquidity. Today there are signs that the market has become overly euphoric. Although I can’t say specifically from this data when that euphoria will end, it seems highly likely that it will in the not too distant future. The end of these periods of unusual euphoria are never pretty.
US macro liquidity growth slowed over the past month. It has barely budged since August 10 of last year, actually slipping 0.2% since then. In contrast, stock prices have risen 6.5% over the same period. Stocks look the most overbought they have been relative to macro liquidity since 2011. That was a very different environment with the Fed going full blast on QE. That makes today the most overbought market in the “no Fed QE” era since late 2014.
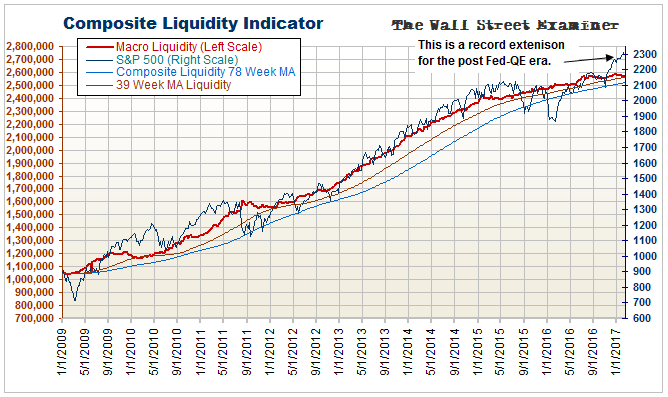
Of course today we have plenty of QE flowing into the US market from the BoJ and ECB, but they have begun slowing their purchase rates. At the same time, Europe has had bouts of cash destruction every few months. That has contributed to the stall in Macro Liquidity growth in the US. Yet stock prices have marched higher as if this were no impediment. It hasn’t been, yet, but this cannot continue indefinitely. Eventually, the market will snap back to the liquidity trend. And as it usually does, it will probably go far below it before bottoming.
The question then becomes how much liquidity destruction will accompany the coming decline. If it’s enough to turn the total liquidity line down, we should finally see the first leg of the long awaited bear market. At that point, confidence in the central banks will have been shattered. Liquidity destruction from both forced and voluntary liquidation will outrun the central banks’ ability to print money.
Macro Liquidity Components – The Fed continues to push more cash into Primary Dealer accounts through replacement purchases of its paid down MBS holdings. These settlements come every month at mid month. Those payments will be diminishing in the months ahead if mortgage rates resume their rise.
Net bank deposits (not coming from money market funds) had an usually sharp decline in January. We can only surmise that depositors suddenly used their deposits to pay off some debt. We saw signs of that in the fact that loan growth has gone flat since October. That’s a bad sign.
Other components of the index were also negative.
Foreign central bank (FCB) purchases and commercial bank buying of Treasuries have weakened over the past month. Banks also saw the value of their trading accounts fall to a new low, breaking the mid 2016 low. A rally followed that low. This time, the break below that level suggests that there may be more selling ahead. Both stocks and bonds have bucked this trend in the past few weeks. That’s unsustainable. Either bank traders must start buying again, or the markets will plunge.
Interest rates in the market had already settled back a few basis points in January, so naturally the Fed didn’t move. The Fed doesn’t lead the market. It follows the market.
Stresses in the European banking system drove rates higher late last year. Those forces have abated for a few weeks. That’s probably temporary as nothing has happened in Europe to fix anything.
I’m in Greece right now. It’s hopeless here. Central Athens fooled me. Once I got out of that small, somewhat vibrant core, I saw that the country is being depopulated and destroyed, one household and one building at a time. More austerity will only speed up those trends. If the country shrinks by 20% over the next 20 years, who and what will be left to repay the debt? Ultimately, Greece will be nothing more than a downtrodden summer resort for Northern Europeans. The country is cheap. It will get a lot cheaper when it goes back to the drachma. The country will be populated only by migrant workers and people to old to move. It won’t be pretty.
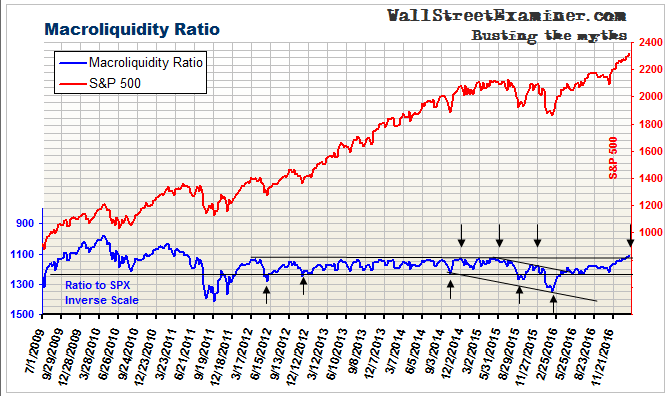
The Macro Liquidity Ratio (below) shows the ratio of the CLI to stock prices. This ratio has surged to a new high in the recovery that began in February 2016. It has edged above the parameter where the market topped out in 2015. It is at its highest level since 2011, when the Fed was going full bore with QE.
The ratio indicator repeatedly touched this apparent overbought level from mid 2013 to mid 2015 and the market never had a serious correction. However, there’s a big difference between that period and now. The Fed was then actively pushing the market higher via QE. Since the Fed stopped QE at the end of 2014, reaching this line has been a pretty good sell signal.
The forces of intrinsic market tightening from financial stress in the rest of the world will continue. These forces have been strong enough to drive market interest rates higher, and stock and bond prices lower, in waves. Those waves come and go. They’re in a quiet period right now. Meanwhile the US undergoes some kind of weird market euphoria. It can’t be sustained without more liquidity. There are signs that we’re near the end of it.
This report is derived from Lee Adler’s Wall Street Examiner Pro Trader Monthly Macro Liquidity Report. Click here to read this post and get a risk free trial.
Lee first reported in 2002 that Fed actions were driving US stock prices. He has tracked and reported on that relationship for his subscribers ever since. Try Lee’s groundbreaking reports on the Fed and the Monetary forces that drive market trends for 3 months risk free, with a full money back guarantee.

