
The NAR released it May report on sales of existing housing–what it calls “Pending Home Sales.” The report covers actual sales contracts reached during the previous month. The NAR reports the data both on a seasonally manipulated (SA) basis and also on an actual basis, not seasonally manipulated (NSA). The media focuses on the SA numbers. In so doing this month, their instant “analysis” reached the wrong conclusion, and we got headlines like CNBC’s:
Pending home sales down 3.7%, marking first annual drop in two years
or The Wall Street Journal’s:
U.S. Pending Home Sales Fell 3.7% in May
National Association of Realtors index also suffered its first annual decline since May 2015
In reality, the SA factor overstated the April to May decline. Furthermore, sales did not decline year to year. The NAR’s data on the actual number of contracts in May had the Pending Home Sales Index at 133.2 in May of 2015 and 136.4 this May. That’s a gain of +2.4% year over year.
This is not a surprise. Contract data from the national online Realtor firm Redfin had already revealed that May was a record month. Even though Redfin’s data is national in scope and comes from the Realtor’s MLS services, and even though it is released weeks before the NAR report, the mainstream media don’t report it.
 Click here to see Chart 1 if viewing in email.
The media used the statistically inexcusable practice of using seasonally adjusted annualized monthly figures to compare year to year performance of the same month. That’s how they reached the wrong conclusion and misrepresented the market.
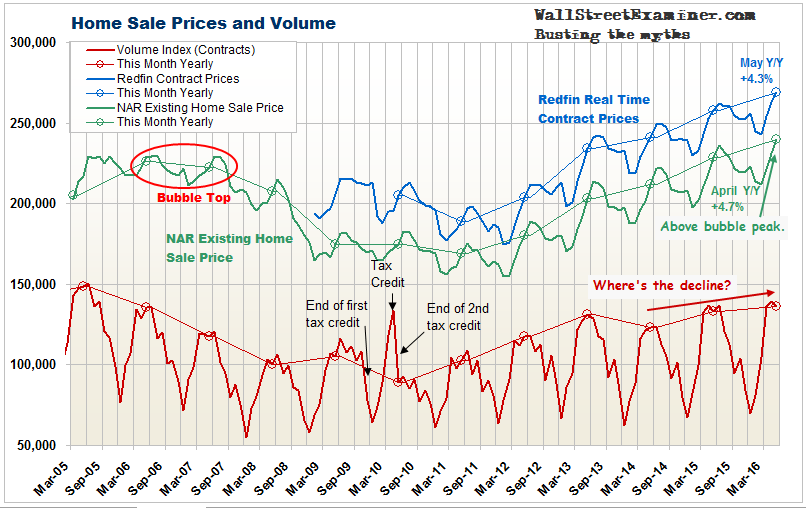
The US existing home sales market is in a mania, driven by inventory shortage and abnormally low, central bank subsidized mortgage rates. May sales activity confirms that. The buying frenzy has not cooled. Current sales volume is at the highest level since the top of the bubble in 2005. It is slightly higher than in May of 2006, although still below the buying climax of 2005. There may be room here for additional price inflation before the buying panic exhausts itself. The price correction would normally follow the manic volume peak. Volume typically precedes price.
May is a swing month where sales are sometimes higher than in April and sometimes not. Month to month actual sales were down 1.9%. That was slightly better than in May of 2015 when sales were down by 2.6%. During the 4 prior years when sales were in a recovery from extremely depressed levels, May gains ranged from +5.3% in 2011 to +1.6% in 2014. The volume of annual activity continued to increase but the pace decelerated. Sales can only increase so much in an inflating market because affordability becomes a limiting factor.
There’s a good chance that this month’s NAR sales figure will be revised up. Redfin covers 26 major US metros representing about 40% of the total sales reported by the NAR. Redfin’s data for May showed not a month to month decline like the NAR’s data, but an increase of 11%. Redfin also showed a year to year increase of 8%. Their data showed that far from cooling down, the mania is heating up.
Click here to see Chart 2 if viewing in email.
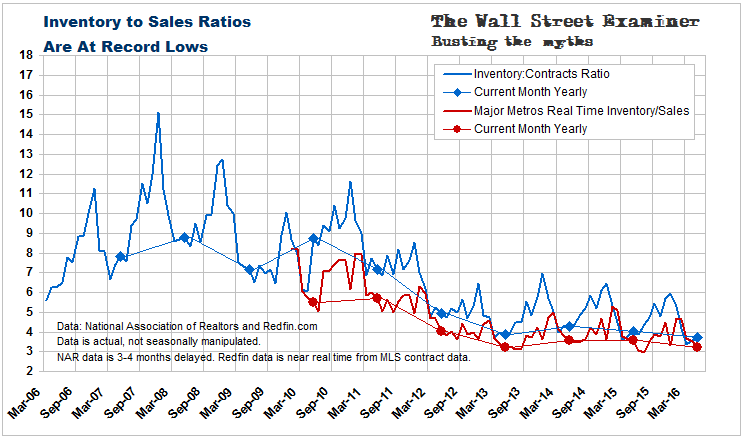
With inventories at record lows and artificially stimulated demand reaching panic proportions, this can only lead to housing inflation heating up. As affordability falls, that will ultimately be bad news for the US economy when this echo bubble can no longer sustain itself.
Click here to see Chart 1 if viewing in email.

