
Home flipping – buying a home and reselling it within 12 months, hopefully for a profit – is the American entrepreneur’s reaction to the vagaries of the housing market. When these gutsy people perceive a big profit opportunity, such as soaring home prices, they pile into the market, and profit grows on trimmed trees and freshly painted walls and rehabbed bathrooms, and flipping volume soars, and the time it takes to complete a flip drops, and nothing can go wrong.
Then something goes wrong. The process reverses, and it takes much longer to complete a flip and volume plunges, and so do profits, and when it gets bad enough, big losses decimate that spirited industry.
And now, something is going wrong. RealtyTrac reported that in Q2 of 2014 fewer than 31,000 single-family homes were flipped across the US, or a 4.6% share of all single-family home sales, down from a 5.9% share in Q1 and down from a 6.2% share in Q2 2013. And single-family homes sales overall were already down from last year. When home prices started to jump in early 2012, largely due to the arrival in certain markets of Wall-Street money in form of private equity firms, REITS, and other “institutional investors,” flippers saw what they needed: instant profits.
When home prices drop, flipping becomes an unprofitable, thankless, and risky business. In 2011, while home prices were still trying to find a bottom, home flippers were bleeding: in Q1 2011, they lost on average of $38,000 per home, at an ROI of -15%. Flips didn’t become profitable in any serious way until Q2 2012, by which time home prices had started to soar. But profits have come under pressure. Flippers averaged a gross profit of just over $46,000 per flip, a return on the initial investment of 21%. That’s down from 24% in Q1, and from 31% a year ago, the highest return in RealtyTrac’s data series going back to 2011. In the chart, note the profit fiasco of Q4 2013: 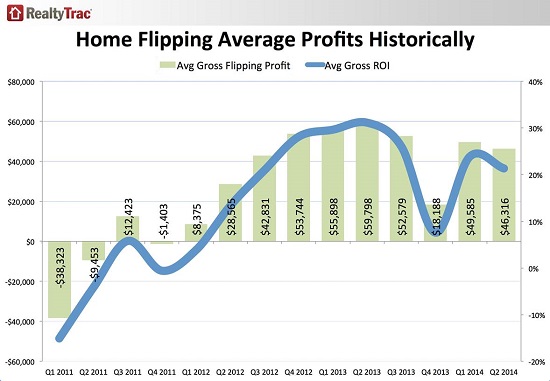 But sales volumes of all homes have been dropping since mid-2013, and now the time to complete a flip has jumped to 187 days on average, from 164 days in Q1, and from 135 days during the peak a year ago. In other words, profits in dollars are down 23% per flip from a year ago, and it takes 39% longer to complete a flip. That’s not a good trend. “Flippers no longer have the luxury of 20 to 30 percent annual price gains to pad their profits,” said Daren Blomquist, vice president at RealtyTrac. And the volume of flips has plunged 61% from a year ago, according to the Flipping Report. This is what the imploding home-flipping bubble looks like:
 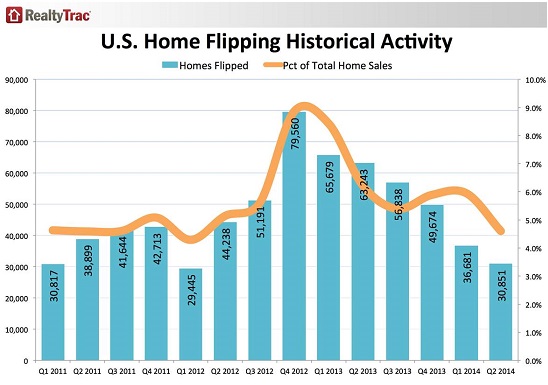 The volume leaders were the usual suspects: Phoenix (1,438 flips), Los Angeles (1,371 flips), and Miami (1,290 flips). But they saw their volume decline, with flipping activity in Phoenix plunging nearly 50% from a year ago! Phoenix has been a harbinger going into the current bubble, and it’s likely a harbinger for the next stage of the bubble’s implosion.
As with the rest of home sales, only the top end is doing well. The number of homes with a flipped sale price of over $400,000 gained share among all flipped homes, and the share of those homes over $750,000 soared. The rest lost momentum. “As the market softens, successful flippers will need to focus on finding properties that they can buy at a discount and efficiently add value to,” Blomquist explained.
So it gets tougher. Flippers end up having to take biggers risks for smaller profits where even minor miscalculations or sudden market swings can lead to losses. As the flipping bubble implodes, and as reality replaces perceived guaranteed returns, many flippers will be hit with losses and will be pushed out.
The industry, as Blomquist said, is “settling back into a more historically normal pattern.” And that pattern is a risky, tough slog even for knowledgeable gutsy entrepreneurs who have the means to survive some bad calls and a market swoon. Homeownership hit the skids when homes became a highly leveraged asset class, flipped and laddered by speculators, rather than lived in by normal folks. Read…. Here’s the Chart that Shows Why the Housing Market Is Sick

