
The headline number released last week for total housing starts in December jumped by 11.3% to a seasonally adjusted (SA) annual rate of 1.226 million. These numbers, released by the Commerce Department, are based on absolute nonsense. They come from the statistically manipulated impression of the trend average over 10 years, using the first release of preliminary data for the current data point.
The 10 year average includes the 5 prior years and the next 5 years in the future. Wait a minute. Is there such a thing as future data? Certainly not in the present, but yes, when it’s released in the future. In the meantime, the SA process induces an estimate of what the next 5 years will look like based on the past 5. Then in each of the next 2 months, and once a year for the next 5 years, government statisticians revise the number. They do that for this month and every other month to fit the actual data for that period, as it becomes available. That way the curve of the SA line ends up perfectly fitting what actually happened 5 years ago.
But as to whether the present release is a good fit to the real trend, who knows? It might reflect reality. It might not. We can’t know whether it does unless we look at the clean, unadjusted actual data. The government provides the actual, not seasonally adjusted (NSA) data in its monthly releases. Wall Street and the mainstream media ignore it. I prefer to look at the actual data. Using a few straight lines on a chart of the data, it’s very easy to see the trend and whether it is changing.
Examining the trend of the actual data tells us whether the headline numbers are on point or not. The actual data gives us the edge of seeing where the market misimpressions are. It enables us to see the false narrative and make our investment decisions on the basis of fact, not fantasy.
Indeed, the Wall Street Journal’s headline on housing starts was fantastic, that is, fully engaged in the fantasy vision.
Housing Starts Jumped in December, Capping Best Year Since 2007
They corrected course a bit by noting in the subhead:
A slowdown in the pace of new apartment building underscores that it may be difficult for construction to hit new highs in 2017
The Journal dutifully reported the headline SA numbers. I was then surprised to see about a third of the way through the post, the reporters got into a bit of disclaiming, bringing the report closer to revealing the truth about the headline nonsense.
The rise in starts follows a drop in activity in November, when new starts dropped by a revised 16.5%. The drop was largely propelled by a 38.7% drop in the construction of buildings with two or more units, which includes apartments and condos.
Single-family housing starts dropped 4% in December while multifamily rebounded 53.9% from a month earlier.
Monthly housing figures are choppy, have a significant margin of error and can be subject to large revisions.
That’s certainly worthy of a pat on the back, especially given that the WSJ is an sister unit of NewsAmerica Marketing. That company is often referred to as just “News America.” Its slogan is “Your marketing objectives are our business.” Another sister unit of the WSJ is Move Inc. which operates the Realtor.com website. It is the marketing arm of the National Association of Realtors. Normally the Journal’s housing related reporting is extremely slanted to the bullish view. You, the reader, are the target and consumer of the marketing. The Journal’s client is the NAR. The Journal reports on behalf of the NAR.
Here’s the actual, not seasonally manipulated performance for December. Total starts fell by 0.7% from November. That is, in fact, strong for the November-December change. The month to month drop in December is usually much larger. In December 2015, starts fell 11.8%. The average month to month change in December over the past 10 years was -7.75%. Only 2012 had a positive December.
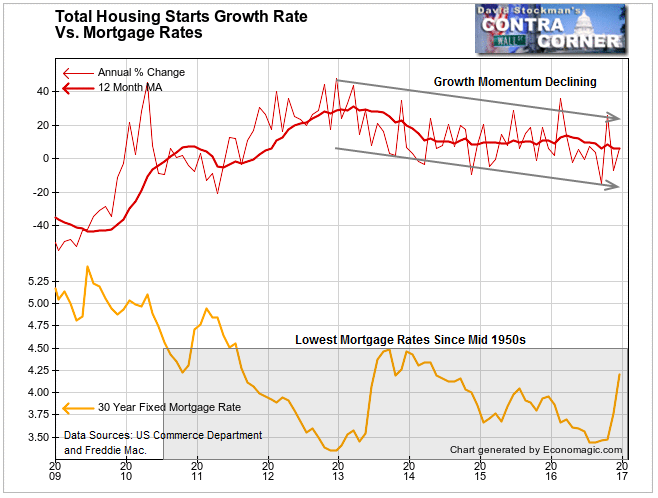
The annual growth rate stood at 6.4% last month, which is the same annual pace as December of 2015. During 2016, the annual growth rate fluctuated wildly from +36% to -15%. That was due to huge fluctuations in multi family starts. The totals are rising with the artificial stimulus of central bank driven all time low mortgage rates.
The Journal’s headline was correct. It was the best year since 2007. But that doesn’t consider the long term historical perspective. The December totals were well below long term averages. Going back to 1974, current December starts bested only the past 7 years, plus 1974-76, 1981-83, and 1990-93. All of the 3 prior periods were recessions.
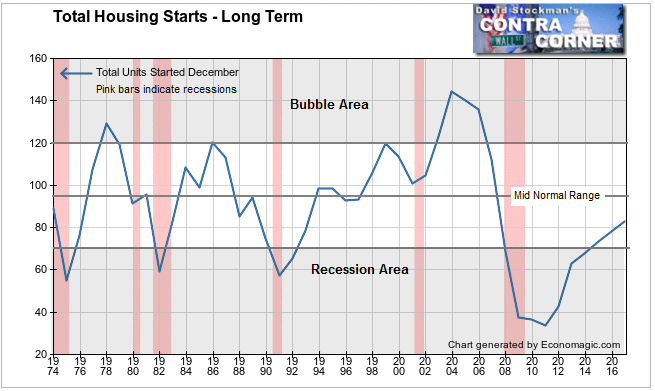
After 5 years of recovery , total starts remain well below historical norms. In addition, the growth slope of the current recovery has been slowing since 2013, in spite of mortgage rates at all time lows.
I have bitterly criticized the Journal’s housing reporting for years. Strikingly, some of my harshest criticisms were actually addressed in their current report.
I have complained that they failed to distinguish that total housing starts are comprised of two industries, single family and multifamily, with different economic drivers, different consumers, and typically, different developers. The Journal partly addressed that in last week’s report.
An estimated 1.17 million housing units were started in 2016, nearly 5% more than were started in 2015—making it the strongest year since 2007. But that rise masked a sharp divergence in the types of residential construction under way. Single-family starts were up 9.3% last year, but construction of buildings with five or more units fell 3.1%.
Actual monthly data confirms the 1.17 million figure.
I have also complained that the reporting focused on the the trend only since the bottom of the recession in 2009. It failed to consider how weak housing has been relative to a long term perspective. The WSJ’s report also partly addressed that.
New home construction has been the weakest element of the overall housing recovery…
The strength of multifamily housing construction has helped buoy housing-start numbers, even as single-family activity remains well below normal levels.
“When you look at single-family [construction] we’re still at recession levels, which is quite remarkable because historically the real-estate cycle leads the business cycle,” said Sam Khater, deputy chief economist at CoreLogic Inc., a housing data firm.
Another complaint that I had was that their reporting failed to consider housing data relative to the growth of population. Amazingly, last week’s post also addressed that.
The numbers look particularly bleak when accounting for population growth. The number of single-family and multifamily starts per 1,000 households remains about 38% below the 50-year average, according to Ralph McLaughlin, chief economist at housing website Trulia.
Apparently, the Journal’s reporters are reading David Stockman’s Contra Corner. It looks as though our criticisms stung them a bit.
I will delve more deeply into the housing starts data in upcoming posts. It’s encouraging to note that the Journal did some real reporting this month. In spite of the rah rah headline, the report was surprisingly balanced. It raised a number of caveats which is something we don’t ordinarily see.
So two cheers for the WSJ.
Lee Adler first reported in 2002 that Fed actions were driving US stock prices. He has tracked and reported on that relationship for his subscribers ever since. Try Lee’s groundbreaking reports on the Fed and the Monetary forces that drive market trends for 3 months risk free, with a full money back guarantee. Be in the know. Subscribe now, risk free!

