
“Many of our major trading partners are experiencing stalled or slowing economies, and the strength of the US Dollar versus other currencies is making US goods more expensive in the export market.” That’s how the Cass/INTTRA Ocean Freight Index report explained the phenomenon.
What happened is this: The volume of US exports shipped by container carrier in July plunged 5.8% from an already dismal level in June, and by 29% from July a year ago. The index is barely above fiasco-month March, which had been the lowest in the history of the index going back to the Financial Crisis.
The index tracks export activity in terms of the numbers of containers shipped from the US. It doesn’t include commodities such as petroleum products that are shipped by specialized carriers. It doesn’t include exports shipped by rail, truck, or pipeline to Mexico and Canada. And it doesn’t include air freight, a tiny percentage of total freight. But it’s a measure of export activity of manufactured and agricultural products shipped by container carrier.
Overall exports have been weak. But the surge in exports of petroleum products and some agricultural products have obscured the collapse in exports of manufactured goods. For now, the currency war waged by all the other major economies catches much of the blame:
The strength of the U.S. dollar against other currencies accounts for a significant part of the drop because of the relative price advantage our competitors have. There is concern that U.S. sellers—especially suppliers of agriculture products and food products such as meats—may have lost customers for good.
That’s the goal of a currency war. But wait… the dollar began to strengthen last year, while containerized exports have been dropping since 2012, when it was the Fed that waged a currency war against other economies, and when it was the dollar that was losing its value. So there are other reasons, long-term structural reasons unrelated to the dollar.
And some of them, the report pointed out:
The global economy is also stumbling, with many countries experiencing contracting or stagnating economies. Export shipments fell to almost two-thirds of our top trading partners. Many of the rest experienced little or no change in their levels.
The index, at 0.664 in July, is 33.6% below the level of January 2010, when it was set at 1.00. It’s less than half of what it was in much of 2010, 2011, and 2012. This is what that multi-year collapse, as documented by Cass/INTTRA Ocean Freight Index, looks like:
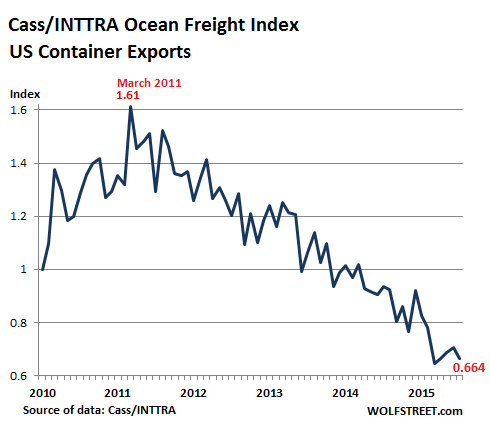
Global trade had essentially come to a halt during the Financial Crisis. But by 2010, container export activity began to surge from very low levels and became part of the V-shaped “recovery.” It peaked in March 2011 of 1.61. But starting in 2012, month after month, interspersed with signs of false hope, it was beginning to fall apart. And now it has run into a global economy that is wheezing!
It’s going to get worse. The index hasn’t yet picked up on China’s devaluation of the yuan, currently at over 3% in two days. More devaluations are likely. The effect is already cascading around developing-market currencies, which are swooning. So the report: “The export market for containerized goods is not showing signs of a turnaround in the near future.”
As US exports become less competitive overseas, imports to the US get cheaper. And they’re already washing ashore tsunami like.
The import container index in July jumped 21.5% from June to the second highest level in the history of the index. It’s up 10.3% from July last year – already a record year for container imports. Much of that increase is due to rising imports from China as the back-to-school and fall merchandise arrived in the US.
But even in this scenario, problems are cropping up, according to the report: “Slow ordering patterns showing up in China’s measure of new orders indicate that US retailers are being a little cautious with their ordering.”
And they should be. Just today, the Census Bureau reported that the already sky-high business inventories – from manufacturers to retailers – rose again. Hampered by lackluster sales, the seasonally adjusted inventory-to-sales ratio reached 1.37, same as in February, the worst level since July 2009, during the Financial Crisis.
At some point, if sales don’t miraculously pick up by a whole lot, businesses are going to cut back ordering and channel-stuffing. This will curtail imports, which will hit China and other countries. And the US is supposed to be the engine that pull’s the global economy out of the quagmire.
There are consequences for the US bond market that has so vigorously and blindly funded all comers. Companies gorged on debt, even junk-rated companies. But now things are coming unglued at the riskiest end. Read… Wall Street Sees Junk Bond Collapse, Prepares to Profit from it
stomers for good.”

