
I was wrong.
I wrote last year that the economists in charge of monetary policy at the Fed were the worst economic forecasters on the planet. To wit:
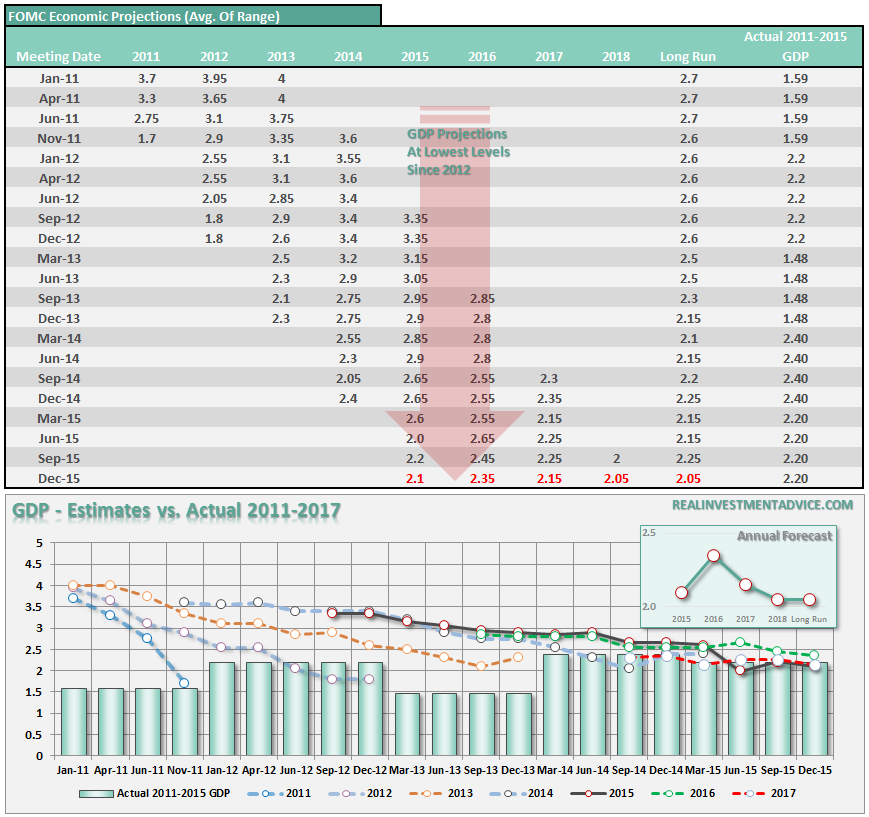
“Importantly, while Janet Yellen suggested the Fed’s economic forecast was ‘not a weak one,’ the reality is it actually was. I have repeatedly stated over the last two years that we are in for a low growth economy due to debt deleveraging, deficits and continued fiscal and monetary policies that are retardants for economic prosperity. The simple fact is that when the economy requires roughly $4 of debt to provide $1 of economic growth – the engine of growth is broken.
Economic data continues to show signs of sluggishness, despite intermittent pops of activity, and with higher taxes, increased healthcare costs, and regulation, the fiscal drag on the economy could be larger than expected.
What is very important is the long run outlook of 2.15% economic growth. As shown in the chart below, real economic growth used to run close to 4%. Today, the Fed’s prediction is down markedly from the 2.7% rate they were predicting in 2011.”
Why anyone actually takes the Federal Reserve’s projections seriously is beyond me. However, as bad as the Fed is at making projections, the IMF has proven to be worse. To wit:
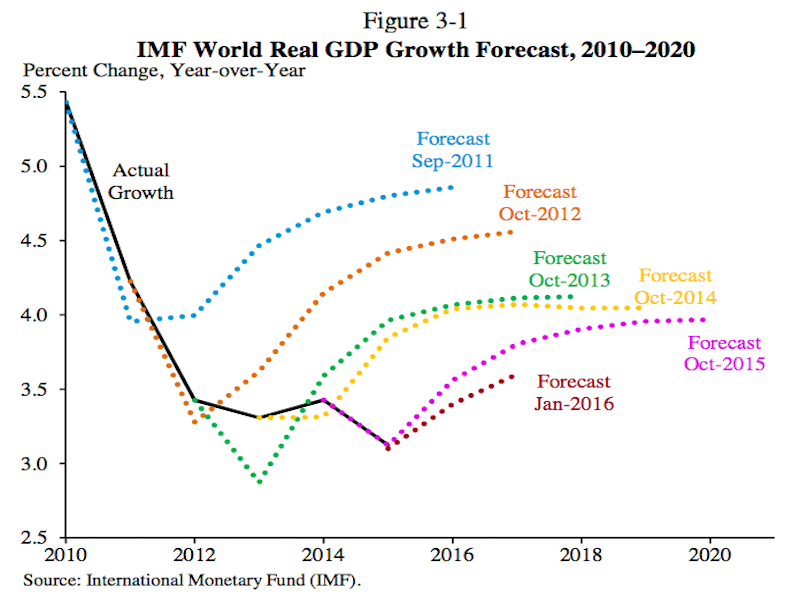
“Since 2010, the International Monetary Fund’s outlook for global growth has disappointed.
And every year, the IMF cuts its global growth forecast only to have that lowered forecast eventually prove too aggressive.
This chart, which comes from the Economic Report of the President, shows the sad state of global growth and perennially disappointed IMF forecasts.
And while the failure of these forecasts for one or two years out is notable, it might be most depressing to see the IMF’s 2011 forecast for 2016 gross-domestic-product growth of 5% miss the mark so widely.”
Considering that Central Banks globally are basing monetary policy decisions on faulty assumptions about economics, the potential for a severe negative outcome is an increasing possibility.
But most importantly, it is probably a good time to stop believing the people making these decisions actually have a level of useful insight. If they did, their forecasts would be substantially more accurate.
This week’s reading list is a collection of articles from people who have been “getting it right” for the last few years. While they are often dismissed by the media because they disagree with “mainstream thinking,” it is quite apparent they had a better grasp of the issues in the end.
1) Earnings & Revenue Confirm Weak Economy by Jeffrey Snider via Alhambra Partners
“Again, with revenue and EPS expected to decline further in Q1, that will make at least four straight quarters of EPS contraction and five for revenue. Currently, analysts are not predicting positive growth in either until Q3, but that is as tenuous as the once much more robust predictions for right now.
S&P Capital IQ, for example, was also as late as the end of September (even after all the August messiness and ongoing uncertainty) projecting slightly positive EPS growth in Q4 and then much better throughout the start and rest of 2016.
They chose to ignore everything in order to follow the mainline narrative. Last January, S&P Capital IQ was calling for almost 12% growth for the S&P 500 overall in both Q3 2015 and FY2015. The reason for that optimism was nothing other than “transitory”, which marks the baseline for all these unraveling forecasts.
In their April 2015 projections they had Q1 2016 EPS growth accelerating to 15.1%, and were still looking for +5% as late as October; they now suggest -2.5%. Estimates for future quarters are also coming down and rapidly: last April and July they expected Q2 2016 EPS growth of more than 13%; down to 6.78% in October and just 1.25% currently. For Q3 2016: also more than 13% at both the April and July estimates, shooting higher to almost 15% at the October update, though now down to 7.22%. Current market disruptions suggest only that these downgrades are far from over.”
But Also Read: S&P Earnings Far Worse Than Advertised by Justin Lahart via WSJ
2) Closing Tick As A Sentiment Tool by Tom McClellan via McClellan
“The robust rally in mid-February 2016 has pushed the TICK’s 10MA up to its highest reading since late 2014 (just off the left end of the chart). The message is that traders were a bit too eager in chasing that counter-trend rally, and so the stage is set for the next leg down. “
But Also Read: I Am Bearish – Period by Doug Kass via Real Clear Markets
3) Difference Between Past Fed Tightening & Now by Comstock Partners
“Another reason we are skeptical about the U.S. economy avoiding a recession in 2016 is because of the breadth being as weak as it was in 2015. The top 10 companies in the S&P 500 accounted for virtually all the gains, but were overwhelmed by the 490 stocks that accounted for the decline in the index. This is also true about the number of stocks in the S&P 500 above the 10 day, 150 day and 200 day moving averages. .
In fact, we believe the Fed’s decisions over the past 20 years were instrumental in the dot com and housing bubbles. In the Fed’s mind they have done everything possible (including increasing their balance sheet from $800 bn. to $4.5tn.) to resurrect the U.S. economy. Instead, their legacy will be tarnished by the outrageous policies that were used over the past 8 years, and in our view, will not result in the salvaging of our economy, but rather what may become one of the greatest destructions of wealth in history.”
Also Read: The Fed’s Nightmare Scenario by Peter Schiff via EuroPacific Capital
4) S&P Could Plunge 75% by Sara Sjolin via MarketWatch
“According to Edwards, global strategist at Société Générale and prominent perma-bear, the stock benchmark could falls as much as 75% from the recent peak of 2,100 to trade around 550. Edwards argues that stocks are already in a bear market—commonly defined as a 20% fall from a recent high—and that U.S. industrial production is shaky and could represent the beginning phases of a recession. That’s bad news for stock-market bulls.
A fall to below 666 would have been a plunge of 65% from Tuesday levels, but if the bottom is around 550, the size of the decline would be 72%. Measured against the recent peak, it would be a steeper 75%.”
Also Read: 3 Day Rally Says Bear Market Is Over by Simon Maierhofer via MarketWatch
5) Houston, You Have A Problem by Terry Wade & Anna Driver via Reuters
“Prices for mansions in Houston’s swankiest neighborhood have tumbled in lock step with crude prices. The Houston Opera has offered free season tickets to patrons who lost their jobs in the oil bust. A fancy restaurant offers cut-price dinners.
Twenty months into the worst oil price crash since the 1980s, well-heeled residents of the world’s oil capital are among the hardest hit largely because tanking energy firm shares make up much of oil and gas executives’ compensation.“
Also Read: Recession Sign That Is 81% Accurate by Jeff Cox via CNBC
MUST READS
- The Problem Of Negative Interest Rates by Rick Rieder via BlackRock
- More Subprime Borrowers Falling Behind by Matt Scully via Bloomberg
- Citi: “We Have A Problem by Tyler Durden via Zero Hedge
- One Chart That Should Scare Investors by Matt Turner via BusinessInsider
- “Gig Economy” – Lots Of Workers, Few Full-Time Jobs by Eric Morath via WSJ
- 100 Reasons To Audit The Fed by Michael Snyder via Economic Collapse
- Beware Of The Second Half-Cycle by John Hussman via Hussman Funds
- Market Calm May Be Short-Lived by Mohamed El-Erian via Bloomberg
- The Big Earnings Con by Jesse Felder via The Felder Report
- Stock Rally Glass – Half Full Or Empty via Dana Lyons via Tumblr
- Agriculture – Asset Worth Harvesting by Michael Lebowitz via 720 Global
- Ranking Global Markets By Valuation by Meb Faber via Faber Research
“Investors are condemned by almost mathematical law to lose” – Ben Graham
Questions, comments, suggestions – please email me.

Lance Roberts
Lance Roberts is a Chief Portfolio Strategist/Economist for Clarity Financial. He is also the host of “The Lance Roberts Show” and Chief Editor of the “Real Investment Advice” website and author of “Real Investment Daily” blog and “Real Investment Report”. Follow Lance on Facebook, Twitter, and Linked-In

