
By Tyler Durden at ZeroHedge
Just over two weeks ago, JPM’s Marko Kolanovic, whose unprecedented ability to predict short-term market moves is starting to seem a little bizarre, warned that the next “significant risk for the S&P500” was the bursting of the “macro momentum bubble.” Specifically, he said that there is an emerging negative feedback loop that is “becoming a significant risk for the S&P 500” adding that “as some assets are near the top and others near the bottom of their historical ranges, we are obviously not experiencing an asset bubble of all risky assets, but rather a bubble in relative performance: we call it a Macro-Momentum bubble.”
In retrospect, following tremendous valuation repricings of several tech stocks, last week’s LinkedIn devastation being the most notable, he was once again right. And over the weekend, he did what he has every right to do: take another well-deserved victory lap.
This is what he said in his February Market Commentary: “Tech Bubble Burst?”
In our 2016 outlook and recent reports, we identified a macro momentum bubble that developed over the past years. We explained its drivers (central banks, passive assets/momentum strategies, etc.) and called for value to outperform momentum assets. We also highlighted the risk of a bear market and recommended increasing exposure to gold and cash as well as increasing exposure to nondollar assets relative to the S&P 500 (EM Equities, Commodities, Value Stocks, etc.). Our view was that a likely catalyst would be the Fed converging toward ECB/BOJ (rather than proceed with planned ~12 rate hikes by end of 2018). In line with these published forecasts, the best performing assets YTD have been Gold (+9%) and VIX (+20%) while S&P 500 and DXY are down (-7%, and -2%, respectively). Momentum stocks are down more than 10% with an acceleration of the selloff in last days. Emerging Market and Energy stocks are starting to outperform the S&P 500 (MSCI Latin America by +5% and Energy by +1% vs. S&P 500 YTD). This specific pattern of asset moves is consistent with a Value-Momentum convergence. We think the outperformance of value assets over momentum assets is likely to continue.
Investors often ask us how significant are distortions and risks in equity sectors that are related to a “macro momentum bubble.” Specifically, the question is that of valuations in the Technology sector, i.e., “is there a Tech bubble”? Before we share our views, let’s first review how passive investing and momentum strategies may have impacted performance of various equity sectors.
Imagine a world in which most of the assets are passively managed and investors are focused on liquidity and short-term risk/reward. Companies that increased in size recently would keep on increasing, and those that got smaller would see further outflows. Past winners would also be considered low-risk holdings compared to past losers. The most successful managers would be those that replace fundamental valuation with a simple rule: buy what went up yesterday and sell what went down. Passive funds would do the same. It is hard to imagine this makes economic sense long term, but it is close to what equity markets experienced over the past several years. In 2013, the Sharpe ratio of the S&P 500 was ~2.7. Assuming a normal distribution of active asset returns, one could (incorrectly) conclude that being just an average (passive) investor one will outperform ~95% of all active investors. In 2014 and 2015, various momentum strategies delivered Sharpe ratios >2. The winning strategy was not just to go with the crowd, but to do what the crowd did yesterday. This type of trend following does not only apply to extrapolating price trends, but also extrapolating trends in fundamental stock data such as growth and earnings. Beyond a certain point, passive investing and trend following are bound to result in distorted equity valuations and misallocation of capital.
While some parts of the Technology sector certainly have reasonable and even low valuations (see our US equity strategy outlook), segments of the Tech sector disproportionally benefited from momentum investing as well as investing based on extrapolation of past growth rates. For instance, a popular group of stocks held by investors is known by the abbreviation “FANG” (Facebook, Amazon, Netflix, Google). We use these stocks as an illustration for a broader group of similar stocks that have the highest rankings according to momentum and growth metrics (and surprisingly in some cases even low volatility metrics). Given that traditional value metrics look expensive when applied to this group, one can compare these momentum/growth companies on a new set of metrics. For instance, one can look at the ratio of current price to earnings that the company delivered over all of its lifetime (instead of just the past year). Another metric could be a ratio of CEO or founder’s net worth to total company earnings delivered during its lifetime (see below):
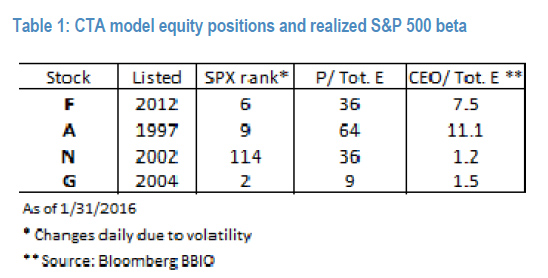
Aggregating all FANG earnings since these companies were listed, one arrives at a ratio of current price to all earnings since inception of ~16x. This can be contrasted to a ratio of price to last years’ earnings for all other S&P 500 companies also at ~16x. We think this is extraordinary given that FANGs are neither small nor new companies. In fact, these are some of the largest companies in the S&P 500 and among the largest holdings of US retirees. Given that the three largest FANG stocks are now twice more valuable than the entire US S&P small-cap universe (600 companies), a legitimate question to ask would be “is such a high allocation by long-term investors to these stocks prudent?” Statistically, over a long period of time smaller companies outperform mega-caps ~75% of times. Note also that the current size ratio of mega-cap stocks to small-cap stocks is at highest level since the tech bubble of 2000. Furthermore, such allocation is also questionable from a risk angle. For example, the idiosyncratic risk of holding three stocks in one sector is certainly much higher than the risk of owning, e.g., ~1,000 medium- or small-cap companies diversified across all sectors and industries.
Investors in high-growth stocks expect innovations to drive growth and sustain high valuation. They may even put their hopes in moonshot projects such as cars built by electronics makers, car makers building spaceships, or internet companies building drones.While many of these could result in important technological breakthroughs, they may also be signs of excess and destruction of shareholders’ capital in the future. Recent examples of capital impairment in the tech sector are illustrated here and here, and more peculiar examples of past excess can be found here and here. In addition to extrapolated and often optimistic growth forecasts, some of the tech sub-industries have high idiosyncratic risks that are likely underappreciated by the market. Standard valuations models incorporate revenue, growth, and profit forecasts but often do not discount for the lifecycle risk of a business. To illustrate: while we are still traveling in aircraft designed over 40 years ago, social network users’ preferences have changed drastically over the past decade (e.g., Friendster and Myspace). A shorter lifecycle is related to low barriers to entry and rapid changes in what is deemed fashionable by young generations (e.g., one cannot build a jetliner in a dorm room, and they don’t go out of fashion as apps do).
In summary, we think that the biases of momentum investing and passive indexation have resulted in valuation distortions across assets as well as equity segments including Technology. Over the past years this trend has picked winning assets, sectors, and stocks often with less regard to fundamental valuation and more regard to momentum and extrapolated growth. We believe that 2016 may result in a reversion of this trend that will give an opportunity to active and value investors to outperform passive indices and momentum investors. Even if this rebalancing comes as a result of market volatility and broader equity declines, long term it will benefit capital markets and the efficient allocation of capital.
* * *
Only problem is that this capital reallocation will means countless momentum chasers ‘smart money managers’ will be out of a job in very short notice.
Then again, judging by some initial reactions, even formerly steadfast believers in the FANGs are starting to bail: moments ago CNBC reported that Mark Cuban announced that he purchased options to sell against his entire stake in Netflix, to wit: “For those of following my stock moves, I just bought puts against my entire Netflix position.”
Cuban posted comments on Cyber Dust social media platform on Friday. Result: NFLX already down -4%, with FB and other tech momos hot on its heels.
Source: Momo Bad News: JPM’s Quant Guru Kolanovic Confirms Tech Bubble Has Burst… Again – ZeroHedge

