
By Tyler Durden at ZeroHedge
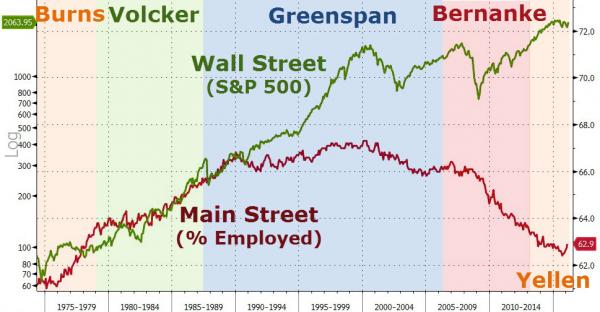
After the stock market crash of 1987, The Federal Reserve embarked on a path that led to the biggest debt bubble in the history of the world. The day after the 1987 crash (Oct. 20, 1987) Alan Greenspan, Chairman of the Fed, announced to the world that The Fed stood ready to provide whatever liquidity was needed by the banking system to prevent the crash from turning into a systemic financial crisis. That was the day the Fed “put” was born.
A put is an option that allows its owner to sell a specified amount of a particular asset at a predetermined price by a specific date. As an example, if an investor had a February 90 put on Apple’s stock that investor would have the right to sell 100 shares at 90 a share until the third Friday in February when the option expired. An investor would only exercise that put if Apple’s stock price dropped below 90 a share before expiration. As it stands Apple’s stock price is 94.02 as of Friday’s close so no rational investor would exercise that put. But if on Monday Apple’s stock crashed and was trading 60 a share than the investor would exercise his put and gladly sell his stock at 90 a share to the person who sold him the put. So in effect after 1987 The Fed was acting as a giant put for the financial markets, a role it had heretofore not played.
In September of 1998 Long Term Capital Management, a highly leveraged high profile hedge fund, sustained losses that threatened its solvency. The fund with a few billion in equity had $80 billion in assets and all of its trades were going against the firm. LTCM’s equity was going to be wiped out within days. Warren Buffet and a consortium of investors offered to bail out the fund by paying fire sale prices for the assets and shutting down the fund. LTCM’s management balked and looked to The Fed for a better solution. The Fed engineered a bailout by numerous banks that left LTCM’s management in place with some of their wealth to spare. Once again, The Fed intervened in a market calamity and this time bailed out an extremely reckless hedge fund that should have been allowed to fail. The Fed’s put engendered moral hazard in the hedge fund community by allowing reckless and destabilizing behavior to go unpunished.
In December of 1999, The Fed injected enormous amounts of liquidity into the banking system to fend off any potential problems from the Y2K problem. If you recall, The Fed was worried that banking computer systems might erroneously register 1900 as the year on January 1, 2000 due to perceived deficiencies in banking software. To avert any panic, The Fed stuffed money into the banking system to make sure no calamities ensued. The stock market which was already in the midst of a mania in the tech sector effectively had kerosene poured on the fire. The extra banking liquidity found its way into the stock market and sent the tech bubble into overdrive. After the new year passed without so much as a hiccup The Fed withdrew the excess liquidity and the tech bubble peaked in March 2000 and then collapsed.
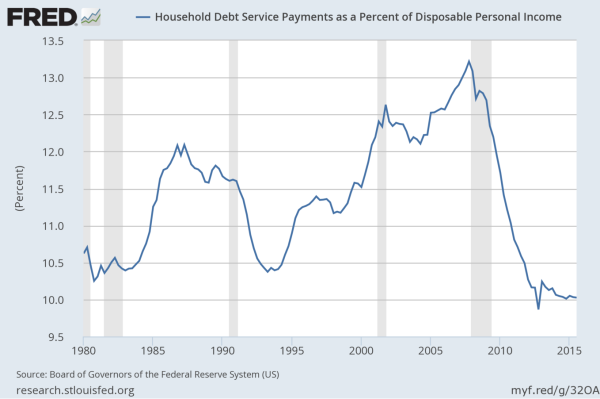
This is where the story of the debt bubble begins. Prior interventions by The Fed promoted moral hazard and rampant speculation but up to this point they did not need to employ debt to prop up the U.S. economy. That all changed after the internet stock mania collapsed, trillions in wealth was destroyed, and the U.S. economy went into recession. The Fed was once again worried that the crash in technology stocks would cause a systemic financial crisis so they embarked on an interest rate cutting program that saw the Fed Funds Rate drop from 6.5% to 1% from 2000 to 2003. This in effect morphed the tech stock bubble into a housing bubble. Adjustable rate mortgage yields plunged in value and accelerated a housing boom already in progress. The public, encouraged by low rates and lax underwriting standards stampeded into housing sending prices through the roof. Mortgage debt exploded and home equity values skyrocketed buffeting the tech collapse induced recession. The average American increased their leverage to all-time highs. Figure 1 shows that by the fourth quarter of 2007 household debt payments as a percentage of disposable income hit a record 13.2% up from 10.5% just 15 years earlier.
The Fed meanwhile did not normalize rates until 2005 when the Fed Funds Rate was back up to 4% on its way to 5.25% by 2006, the year the housing boom peaked. Total debt in the U.S. went from $18 trillion in 2001 to $30 trillion by 2007. Comparatively speaking it took 35 years for total debt in the U.S. to go from under $1 trillion to $4 trillion. As we all know the collapse in housing prices revealed that trillions in mortgage backed securities were not actually AAA rated and the collapse in value of these securities almost took the financial system with them.
Large investment banks, like Bear Stearns and Merrill Lynch, became insolvent and were forced to merge with better capitalized banks. Lehman Bros. was allowed to fail and brought the global financial system to its knees. The Fed, now headed by Ben Bernanke, went into overdrive slashing the Fed Funds rate to zero percent and essentially backstopping all financial institutions and depositors’ cash and near cash investments.
A new tool was introduced by The Fed, called Quantitative Easing, which allowed The Fed to purchase mortgage backed securities and other long dated debt to push down long term interest rates and encourage lending. Rates at both the front end and the back end of the yield curve plunged to historic lows with the hope that people and businesses would begin to borrow again and get the economy growing. These extreme measures stopped the free fall in financial assets and began a six-year expansion that was both meager and debt fueled.
During and following The Global Financial Crisis consumers in some developed countries deleveraged but the rest of the economy, namely governments and businesses, leveraged up. From the first quarter of 2008 to the second quarter of 2015 total debt in the U.S. increased from $30 trillion to $40 trillion. Globally, total debt grew from $142 trillion in the fourth quarter of 2007 to $200 trillion in the second quarter of 2014, an increase of $58 trillion. Total global debt as a percentage of global GDP grew from 269% in 2007 to 286% in 2014. The massive central bank intervention during The Global Financial Crisis prevented a deleveraging of the global economy and actually encouraged more leverage to stimulate growth. Once again the planet was borrowing from future growth to propel current growth. This was indeed a short sighted solution to an existential crisis faced by the world. Kicking the can down to 2016 has now come to its logical end.
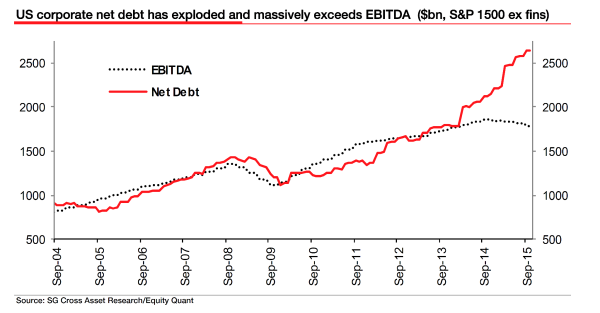
During 2015 the strength of the global economy began to be questioned as commodity prices collapsed, Chinese economic growth slowed, and global trade slowed. For the first time since the European Sovereign Debt Crisis credit spreads began to widen and low rated corporate debt and leveraged loans began declining in value. As seen by Figure 2 Corporate Net Debt to Ebitda rose to record levels while Ebitda began to decline.
Declining oil prices crushed low rated high yield energy debt. Figure 3 shows that prices of CCC rated debt collapsed in the fourth quarter of 2015.
Also in the first quarter of 2016 low rated commercial real estate debt plunged in value as seen in Figure 4.
Declining oil prices crushed low rated high yield energy debt. Figure 3 shows that prices of CCC rated debt collapsed in the fourth quarter of 2015.
The more aggressive investor can find opportunities to earn high returns employing strategies that will benefit from a financial collapse and a severe, deflationary recession. These strategies include shorting stock index futures, getting long VIX futures, etfs, and options, getting long stock index option volatility via index etfs, and on a limited basis shorting individual company stocks whose business plans will be acutely affected by economic developments.
We would not simply be short financial assets every day because we recognize that the markets will initially be quite volatile which means sharp bear market rallies in between dramatic declines in financial assets. We would initially be positioned to benefit from this two-way volatility and as the declines become more severe and investors begin to throw in the towel the fund will be more short oriented.
We recognize that The Fed will not sit idly by as this bear market intensifies. However limited their options they will employ them and they may provide brief respite from the bear market. We believe The Fed will stop raising interest rates and begin cutting them in 2016 taking them into negative territory. We also believe The Fed will embark on QE4, although it is not clear what assets they will purchase. What is clear is that rate cuts and QE4 will offer brief pauses in financial asset declines but will not ultimately arrest those declines.
Major fiscal policy adjustments will be needed and this will depend on who takes the White House in 2017. A Democratic win would be a negative while a Republican win by certain candidates may pave the way for major fiscal policy changes. For instance, Ted Cruz’s flat tax would be particularly beneficial and soften the blow of the economic contraction as more money will be directly put into Americans’ hands.
We also believe the next President needs to strip The Fed of their dual mandate of price stability and full employment. The Fed should no longer be tasked with ensuring full employment and debt creation should be disincentivized through changes to the tax code.
Lastly, we would like to highlight we take no pleasure in what we see coming to pass in the financial markets and simply wants to offer investors the opportunity to earn high returns in what otherwise will be an environment devoid of financial opportunities and of declining employment.
Source: 2016: The End Of The Global Debt Super Cycle – ZeroHedge

