
This post is an excerpt from the weekly review of the Fed’s liabilities and other banking system data that is crucial to understanding the context of financial market behavior, in the Wall Street Examiner Pro Trader Macroliquidity Reports. Macroliquidity Pro Trader weekly subscribers (or Professional Edition), click here to download complete report in pdf format.
Where else can we review the weekly balance sheet changes of a major corporation, bank, or other financial institution weekly? The Fed provides the means for us to look at its balance sheet every week and actually follow the flows of funds as they move from the Fed to the Federal Government to the banks and vice versa. That was particularly useful during QE because we could see each week exactly how the Fed printed money and it would enter both the banking system, the financial markets, and the economic stream. Without QE, it’s not as sexy a pursuit today, but it’s still one that is worthwhile because it enhances our understanding of just how all the levers and pulleys work.
If you have a background in accounting or at least a couple of college level courses you should be able to recognize the usefulness of this data instantly. If you lack that background, don’t worry, I track, analyze and explain it for you week in and week out so that in a few weeks time, you too will clearly understand just how the funds enter and influence the markets and the economy.
Here’s what it looks like this week.
Click to view if reading in email
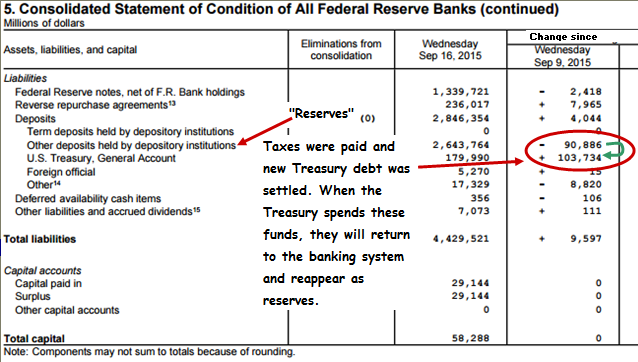
The US Treasury had net deposits of a massive $104 billion to its checking account at the Fed last week as it took in quarterly estimated taxes from individuals and corporations and had a mid month bond and note sales settlement. It continues to carry a record cash balance (see Federal Revenues Report) for this time of year but the margin is rapidly dwindling as the Treasury cuts back on bill offerings to avoid running over the debt ceiling.
Regular bank reserve deposits called “Other deposits held by depository institutions” saw net withdrawals of $90.9 billion. Here we can clearly see the withdrawals from the banks to cover the tax payments and purchases of Treasury debt. As the Treasury spends these funds, they’ll re-enter the economic stream and the payees will deposit the funds in their banks. The Treasury’s balance at the Fed will decline and bank reserves will rebound.
Other deposits, which include the accounts of Primary Dealers and GSEs also had a modest decline. Even though the Fed had bought MBS from the dealers with deposits to their accounts on 9/14, the amount was less than the amounts the dealers withdrew to cover their Treasury purchases and other business.
The MBS settlements have been diminishing in size to the point that the cash can be moved in and out of these accounts within the space of a statement week, so that we would not see the flows. When QE was under way, the monthly MBS settlements were so large that it took longer to move the funds and we were able to clearly see the flows into and out of this line item week to week. The shrinkage in these flows may not yet be to a point where they are now immaterial to the market, but they are certainly approaching that as the MBS replacement purchases trend lower.
Reverse Repos outstanding rose by $8 billion, not a large change. This program has also been shrinking as third party participants have less free cash to put into this program and banks have little incentive to move funds from their reserve deposit accounts (Other deposits held by depository institutions) to RRP accounts. With the Fed deciding to again postpone the charade of pretending to raise interest rates, this won’t be an issue for another 6 weeks at least. But even if and when they do, there is little effective difference between a regular deposit account and an overnight RRP. To the banks it’s virtually the same as cash.
The net result of all the changes was an increase of $9.6 billion in total Fed liabilities as required to fund a similar increase in the asset side of the balance sheet from the settlement of MBS purchases on September 14. The next H.4.1 statement to be posted Thursday evening for the week ended today will reflect another $21 billion or so in assets and liabilities as the Fed completed its mid month round of MBS settlements on September 21. That brings the Fed’s balance sheet back to level with its peak holdings at the end of QE in October 2014.
In the weeks ahead assets will decline a bit as MBS paydowns hit the balance sheet. Like clockwork the Fed will settle its next round of replacement purchases in mid October.
The next report for Macroliquidity Investor Monthly subscribers will be posted at the turn of the month.
You can now subscribe to this report as part of the Macroliquidity Pro Trader Weekly or Macroliquidity Investor Monthly on a standalone monthly or weekly basis.
Liquidity moves markets!

