When the financial media and the economic priesthood talk about inflation, they’re really not talking about inflation. As classically defined, inflation is “a rise in the general price level.” Official “inflation” measures actually count only a limited, arbitrarily defined, and constantly changing combination of consumer goods and services, that end up grossly understating the inflation rate.
Measuring only consumption goods and services they miss the vast majority of items that have prices. In particular they miss asset prices, including our homes, our commercial and industrial real estate, our agricultural, commercial, industrial, and residential land, and our financial assets including stocks, bonds, and derivatives. They do not include commodities, producer prices, or wholesale prices.
The most popular measure of “inflation,” the CPI, measures none of that. It is hardly a measure of an “increase in the general price level.” The Fed’s favorite “inflation” measure, the PCE is even farther away. The BEA, which formulates and calculates the PCE even goes so far as to reduce the weighting of items that are inflating the most in price, on the theory that consumers will substitute cheaper goods for those rising fastest in price. CPI does something similar called hedonic pricing. Now I ask you, what does an index of rising prices that includes only those items whose prices are rising the slowest and excludes those rising fastest have to do with the “general price level.”
The BLS, which calculates the CPI, doesn’t even mention the word “inflation” anywhere in its monthly reports or explanatory notes. That’s to its credit. That doesn’t stop the media and the economic priesthood from using “CPI” interchangeably with “inflation”. Justin Lahart in a piece in Wednesday’s Wall Street Journal, in the wake of this week’s CPI news and the Fed moving to tighten wrote, “Inflation is cooling again, and the Federal Reserve hopes that is only a temporary thing.” He didn’t say CPI is cooling. He said inflation is cooling.
In fact, all financial journos do this. They conflate “inflation” with CPI. Stocks have risen to all time highs, up about 16% this year. No problem, stocks don’t inflate. Commercial real estate prices are at all time highs, by far, but that too is no problem. The prices of buildings don’t inflate. They “appreciate.”
This is especially true about US home prices which have persistently been rising at a 6-7% annual rate in recent months. No problem there. Home prices don’t inflate. In fact, you will never, EVER, see a news article about the inflation rate of housing that uses the word “inflation.” It’s always “growth,” or “rise,” or “appreciation.” The economic priests and their media handmaidens are brainwashers, and they’ve successfully brainwashed most of the public.
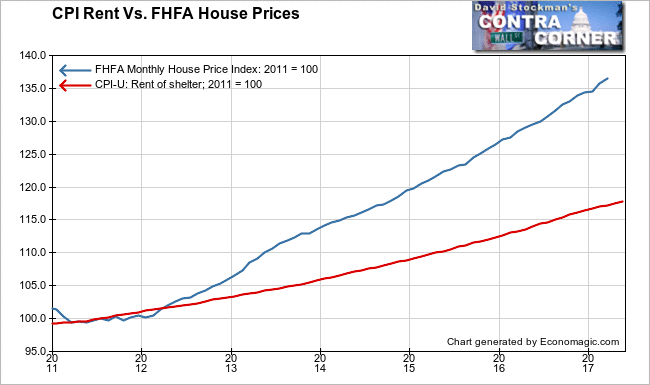
Then there are the tricks the government statisticians and economists use to suppress the rate of increase in the CPI. We’ve talked about that many times. They use a phoney baloney substitute for home prices called Owners’ Equivalent Rent (OER), which doesn’t even measure rent correctly. Even though market rent inflation has cooled in the past year, the rent measure used by the BLS is years behind on both rent inflation and home price inflation. Here’s an illustration. The measure CPI-Rent of Shelter is the basis for OER.

The Wall Street Journal featured this headline re the BLS’s May CPI report:

adding:
The consumer-price index, which measures what Americans pay for everything from dog food to doctors’ visits, declined a seasonally adjusted 0.1% in May from the prior month, the Labor Department said Wednesday. Excluding the often-volatile categories of food and energy, so-called core prices rose only 0.1% from April.
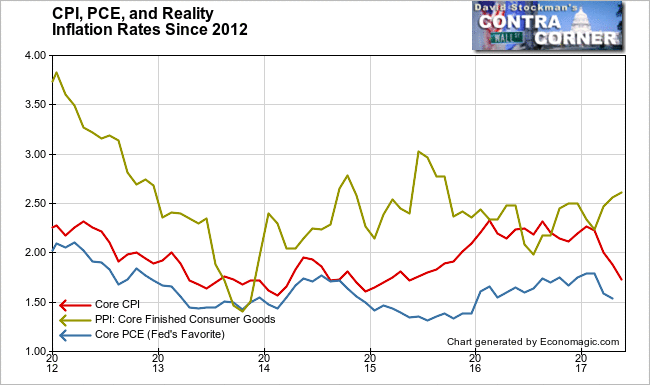
From a year earlier, consumer prices rose 1.9%, the third straight month annual gains have eased and the lowest reading since November. Prices were up 1.7% on the year when excluding food and energy, the weakest mark in two years.
That of course refers to the seasonally adjusted number, which is often misleading because it distorts or hides the direction of the actual data.
I always thought it made sense just to look at the actual, not seasonally adjusted data, and analyze that. The mainstream media ignores that data even though the BLS provides it. The Wall Street Journal, and every other mainstream publication, never has any mention whatsoever of the actual, unadjusted data. That’s in spite of the fact that it’s readily available and painfully easy to analyze.
So here are the actual numbers. The headline number, including food and energy did not decline 0.1% from April. It rose 0.1%. There’s actually little basis for seasonally adjusting an April-Maychange, but the BLS does it anyway. On a full year basis, the index rose 1.9%. It was the third month of declining momentum in the annual rate of change, but that’s not the issue.
Just a reminder–the CPI does not include home prices, which rose 2.5% in May according to Redfin.com. Redfin accumulates MLS sales data from 44 large metro areas across the US. The year to year change in home prices was 6.8%. The BLS only imputed its substitute for home prices, OER, at an increase of 0.2% for the month and 3.3% year over year. In other words, actual housing inflation was 10 times greater than what the CPI included on a month to month basis, and twice as large on an annual basis.
The housing component of CPI accounts for 31% of total CPI. Had actual housing prices been used instead of OER, the month to month change in CPI would have been 0.8% not 0.1%. On a year to year basis, total CPI would have been 3%, not 1.1%. So much for the Fed missing its “inflation target.” Properly measured, inflation would be at least 3%, disregarding the rest of US real estate prices and financial asset prices.
Core CPI, excluding food and energy, rose by 0.1% on an actual, not seasonally adjusted (NSA) basis. Here the seasonally adjusted headlines did not mislead for a change. On a year to year basis, actual Core CPI was up 1.7%, again, the same as the headline numbers. This doesn’t happen often.
The important fact again is the housing component. Housing comprises approximately 41% of Core CPI. Had actual home prices been used instead of OER, the month to month increase would have been not 0.1%, but 1.1%! The year to year change would have been +4.5%, not +1.7%.
Any measure of inflation that excludes housing can not remotely be considered a measure of the “general price level.” The CPI doesn’t measure inflation. It doesn’t attempt to measure inflation. The BLS never uses that word in its reporting. If we want to come closer to the general price level we should at least include housing prices, not even considering financial assets, heaven forbid. When we do that, inflation is somewhere around 3% including non core items, especially energy which is deflating. It is closer to 4.5% on core items excluding food and energy.
Furthermore, using a measure which excludes housing entirely, the PPI for finished consumer goods, the annual rate of increase is at 2.6% and rising, not falling like CPI and PCE. The idea that inflation is below 2% a year is completely absurd.

Based on public remarks by Fed governors and district presidents, I have no doubt that the Fed really doesn’t care about the CPI or the PCE anyway. The Fed is focused on asset prices, which they believe are in a bubble. The Fed tightened in the last two major cycles in 2000 and 2007 because of the same problem. In 2000 it was tech stocks they were worried about. In 2007, it was housing. Here again, asset inflation is why they announced this week that they will begin tightening in earnest by draining funds from the system beginning later this year.
The media reports said that the low CPI numbers would complicate the Fed’s task. That’s nonsense. There’s no reason that low reported CPI numbers would deter them from tightening.
Lee first reported in 2002 that Fed actions were driving US stock prices. He has tracked and reported on that relationship for his subscribers ever since. Try Lee’s groundbreaking reports on the Fed and the Monetary forces that drive market trends for 3 months risk free, with a full money back guarantee. Be in the know. Subscribe now, risk free!


