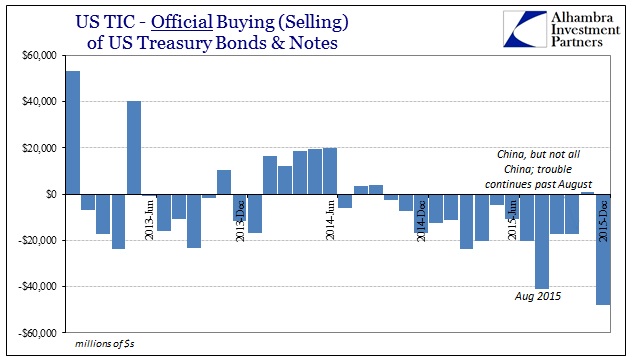
December was one of the worst months on record for foreign dealing with the “dollar.” The latest TIC update further confirms why January was under such persistent and heavy liquidation pressure in almost every corner. There was a record monthly amount of “selling UST’s” in foreign channels, a dearth of private “dollar” activity and, perhaps most important of all, bank liabilities for the last quarter of 2015 shrinking again at a troubling rate.
Just starting with the monthly overall total, the funding disorder is plainly evident in comparison to some of the worst financial months.
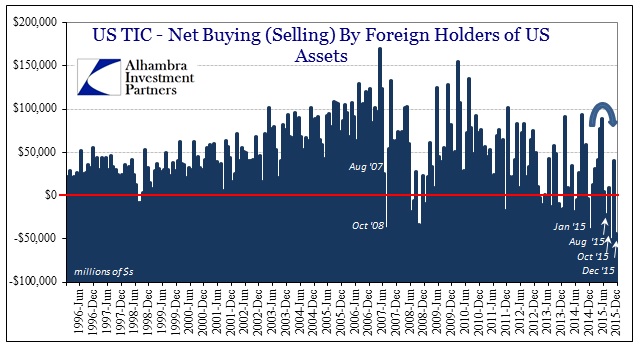
The huge “selling” pressure (and it should be pointed out again that “selling” UST’s and dollar-denominated assets in this context might be something other than liquidation; it could very well be an accounting transfer across jurisdictions, such as repo or derivative collateral flows, which leave market prices undisturbed but have enormous funding ramifications) was coming from the “official” sector, meaning foreign central banks and/or governments. As noted above, the one-month decline was by far the largest on record.
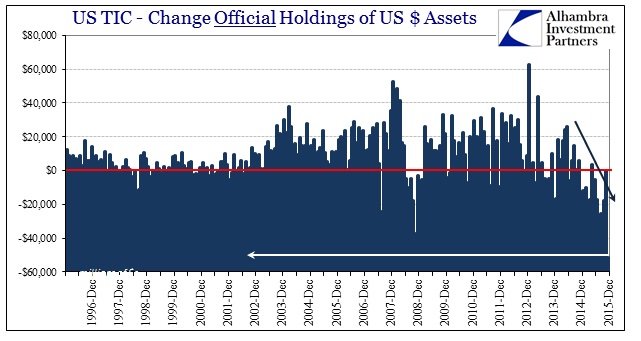
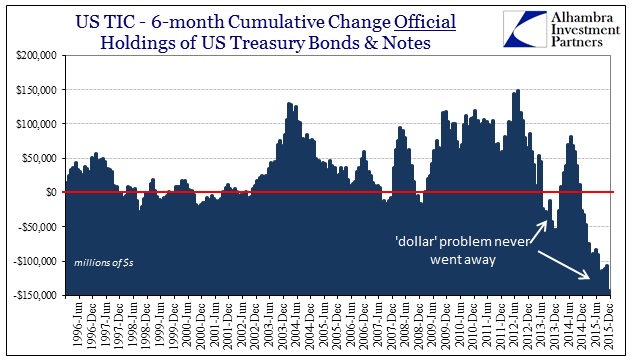
Since foreign “reserves” often follow in the form of UST’s, that was the asset class primarily responsible for signaling the distress.
The foreign private side accumulated very little of US$ assets in December, continuing at a small pace consistent with what we have seen throughout the various phases of the “rising dollar.”
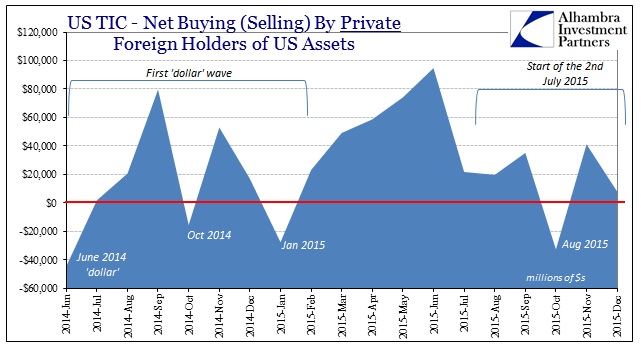
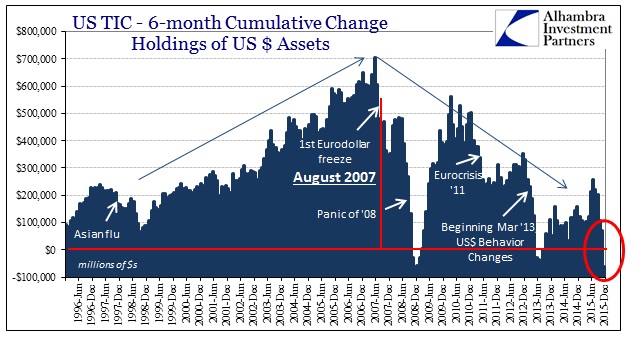
On a cumulative basis, overall TIC estimates show a huge change since July 2015. That would correspond to two global liquidation events and constant funding pressure across the global eurodollar (and euro-currency) network. If foreign official channels are being forced to respond is such dramatic fashion, such reactivity is clearly due to bank balance sheet reductions.
There was, as I pointed out in the November TIC update, an unusual decline in estimated bank dollar liabilities in the middle month of Q4 which suggested that the overall quarterly pullback would be once more quite large. December’s estimate of -$127 billion was a smaller decline than many of the prior quarter-end months, but combined with the huge and unusual drop in November it did leave Q4 as consistent with prior quarters of heavy declines – which are then followed by significant liquidation events or global disruptions.
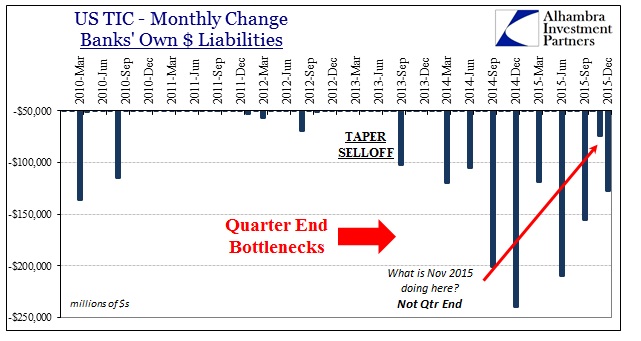
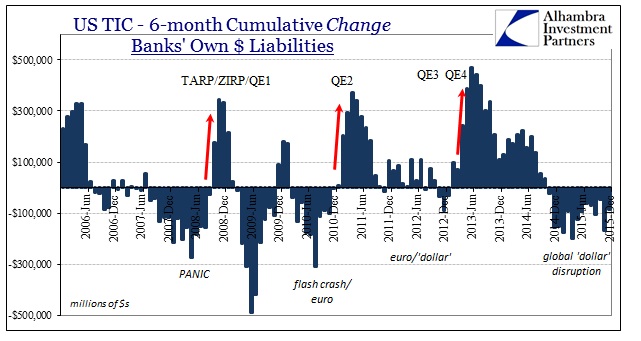
In Q3 2014, bank dollar liabilities fell by $64 billion leading to the events of October 15 shortly after quarter end; Q4 2014 showed a decline of $93 billion, toward the end of which the ruble crisis and first junk bond selloff hit, and then just after quarter end the events of January 15 and the “sudden” Swiss action; Q1 2015 was relatively tame, with bank dollar liabilities nearly flat followed by far more placid market conditions almost everywhere; Q2 was another $90+ billion decline which then resulted in the next “dollar” run starting in early July and culminating in the events of August 2015; Q3 last year was again more placid and nearly flat, leaving less general pressure in October and at least the early part of November in asset markets; and now Q4 at nearly -$75 billion features more junk selloff, huge central bank interventions and then the events of January 2016.
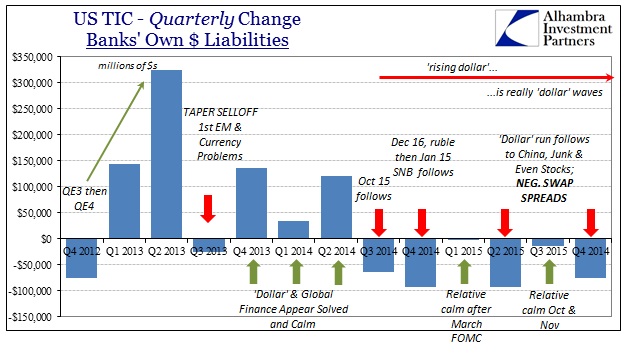
Dating back to June 2014, the TIC figures estimate that reported bank dollar liabilities have dropped by a cumulative $442 billion, starting to answer why China’s “outflows” don’t show up anywhere else. It is an overall “dollar” “outflow” that acts like a shrinking money supply, meaning that $442 billion is just the beginning, leaving far more destruction unseen and uncounted. Over the 19 months before June 2014, dating back to the start of QE3, reported bank liabilities had increased by an enormous $817 billion, suggesting the true scale of monetary destruction (net $1.2 trillion gamma) and also why EM corporate debt was so favorably received in bulk.
The only other times we have seen bank balance sheet (foreign) contraction on this scale over a similarly sustained period was the 19 months ended July 2010 (capturing two liquidations; the last of the 2008 panic in early 2009 and the renewed funding issues over European concerns in the first half of 2010) and the 19 months ended July 2009 (inclusive of the full panic from the start of 2008). That raises the question as to why US markets have appeared much more resilient this time as compared to 2008 or perhaps 2010, but that point might only apply to stocks and certain parts of the credit markets (some junk bonds and leveraged loans are already trading at prices, yields and indications comparable to 2008 and worse than 2010).
For stocks and other relatively more buoyant assets, it is as I suggested here in that these figures represent that most of the financial (and related economic) destruction has been kept offshore until only recently under intensification. While there are individual factors to consider, the offshore “dollar” as leading indicator suggests the direction US markets and the economy will eventually take and perhaps even the magnitude with which it might all settle (certainly those onshore markets already pricing 2008 comparisons suggest as much, including collapsing money curves and inflation expectations).
Chinese problems are proportionally represented in these figures as expected but we should be careful to note that the “dollar’s” reversal is not being borne by China alone. The inflection or shift in financial behavior is reflected across a large expanse of geography and economy.
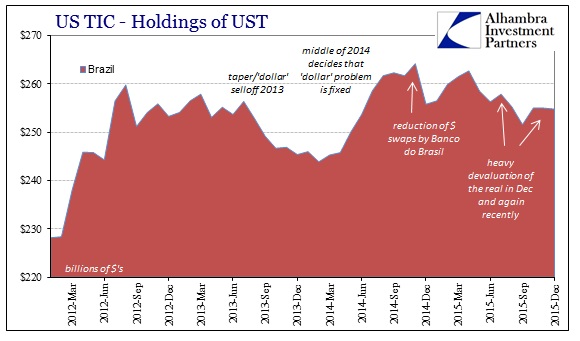
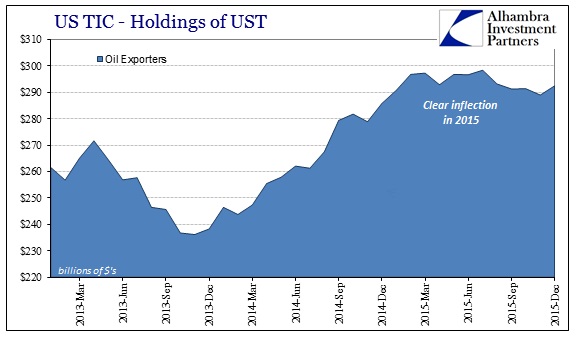
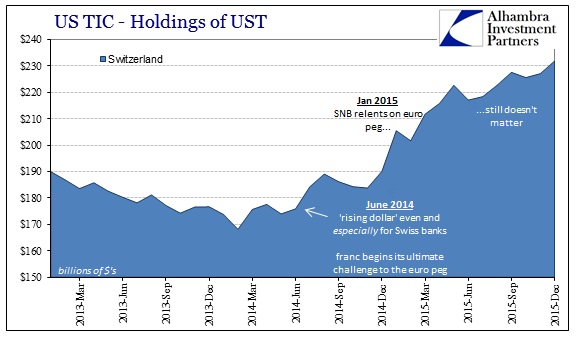
That leaves Chinese focus by indirect proxy, including, it would seem, Japan and Japanese banks as “dollar” conduits.
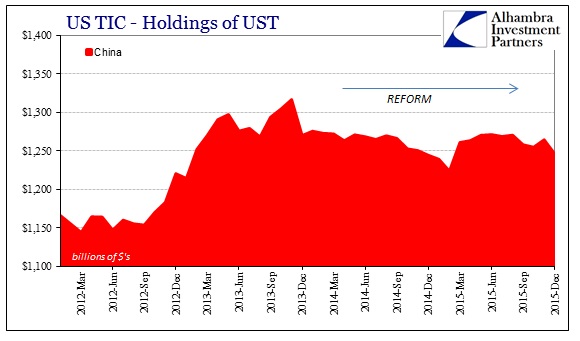
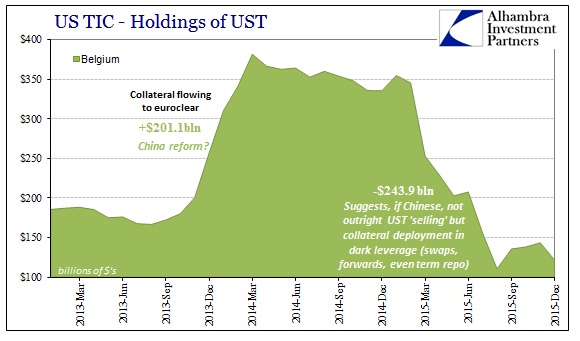
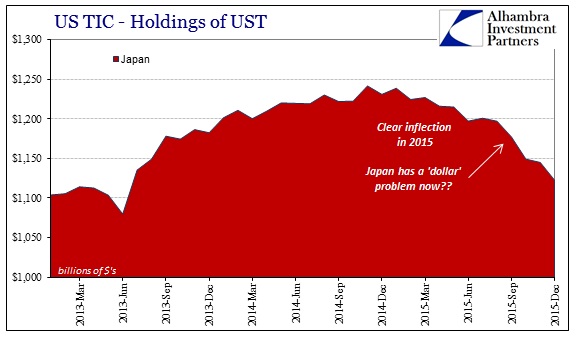
The sum total of the TIC estimates provides another cumulative confirmation that the “dollar” problem is huge, widespread and originating with banks that no longer wish to act as money dealers. As in 2008, these factors leave central banks with no choice but to try to pick up the slack which they can never do but badly and ineptly. Economic and financial behavior past the middle of last year, broadly speaking, bears that out.


