
The Durable Goods Orders report is another data series sending a stark warning to investors. That warning is not apparent in the headline numbers or mainstream media reports.
This post will show you the real story that the mainstream media is hiding. It will help you be able to preserve your capital in the massive stock market adjustment that’s just over the horizon. We can’t see it yet, but it’s there.
The mainstream media doesn’t give you the facts you need to accomplish that. Instead it tries to manipulate you so that Wall Street can skim your money. It may not be willful misinformation but the effect is the same. They mislead you.
I have been reading the Wall Street Journal since I was 17 years old. That’s 49 years of bull. I learned way back that the Journal rarely reports the facts accurately and rarely reaches the right conclusions.
In recent decades other mainstream media outlets have joined the Journal in misleading you. They include CNBC and Bloomberg, and to a lesser extent Fox Business Channel. Seeing how often the Wall Street media was wrong drove me to look behind the headlines at the actual data so that I can help my readers see the facts and invest accordingly.
The government does use statistical trickery to manipulate the headline numbers. But beneath those top line numbers lies a treasure trove of actual data. We can explore and chart that data to reveal what’s really going on in the US economy.
In that vein, first let’s look at what Wall Street is telling you. Then I’ll show you pictures of the data that reveal the truth for you.
The Wall Street Journal reported on Wednesday that:
U.S. Durable-Goods Orders Post Biggest Jump in a Year
The 4.8% rise paced by near doubling of orders in the volatile civilian aircraft sector
Demand for long-lasting manufactured goods rose in October at the fastest pace in a year, a sign the U.S. factory sector has begun to stabilize.
Orders for durable goods—products designed to last longer than three years, such as trucks, computers and metals—rose 4.8% to a seasonally adjusted $239.4 billion from a month earlier, the Commerce Department said Wednesday. Economists surveyed by The Wall Street Journal expected a 2.7% gain in overall orders.
As always, the WSJ and all the mainstream media report only the seasonally adjusted impressionistic representation. They ignore the actual data. Actual data is Not Seasonally Adjusted (NSA).
We look at the actual data before the statisticians get their hands on it and finagle it. Because there’s no seasonal manipulation in the actual data, the question is how the current month compares with the same month in past years.
In October, new durable goods orders fell by 0.9%. However, that’s not as bad as it looks at first glance. Over the past 10 years October has been a down month in all but 2 of those years. October 2007 had a big gain. That gain came just as the US economy was headed into a crash. One atypical strong month can signal the final speculative orgy of a dying trend.
This October’s drop of 0.9% was the third strongest performance of the past 10 years. On its own, that doesn’t mean much. So I look at the annual growth rate to see if the trend is heating up or slowing down. The annual growth rate in October was +1.3%.
That’s slow. It’s barely better than the rate of population growth. The annual growth rate has been fluctuating around zero since November 2014. There’s absolutely nothing new in this month’s report. The Wall Street Journal is right. The US factory sector has begun to stabilize. At zero.
Let’s all jump for joy!
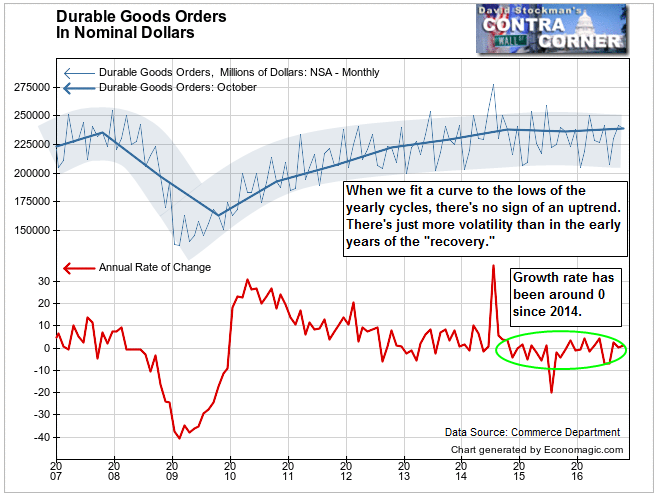
The recovery cycle has never truly exceeded the peak of the housing bubble cycle in 2007, as you can see above. And this is with the help of inflation being included in these numbers.
I’ll show you the real, inflation adjusted levels below, but first consider that the stock market keeps carving out new highs.
Does the durable goods trend justify that? Here’s that picture.
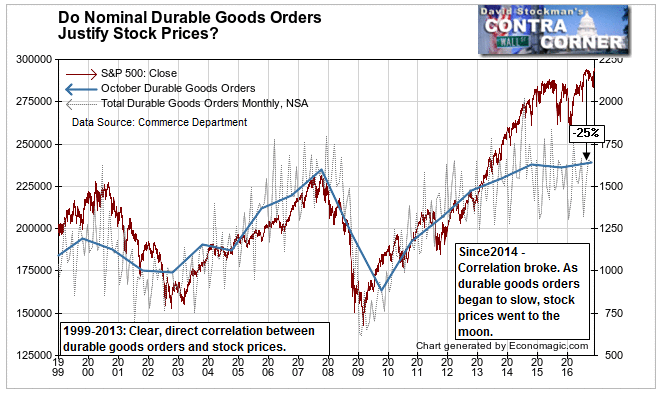
It’s pretty clear that the stock market has become divorced from reality over the past 3 years. If this picture is any guide, there is huge risk in stock prices at this level. If stock prices stuck to the correlation that existed from 1999-2013, the S&P 500 would be around 1650 instead of 2200. That would imply a loss of 25% from current levels. It would get worse from there if the economy weakens and durable goods orders slow.
It gets uglier. When we adjust the nominal durable goods orders for inflation we get a picture of the actual unit volume of new orders. Real orders were actually down 0.4% year to year, as adjusted by the Producer Price Index.
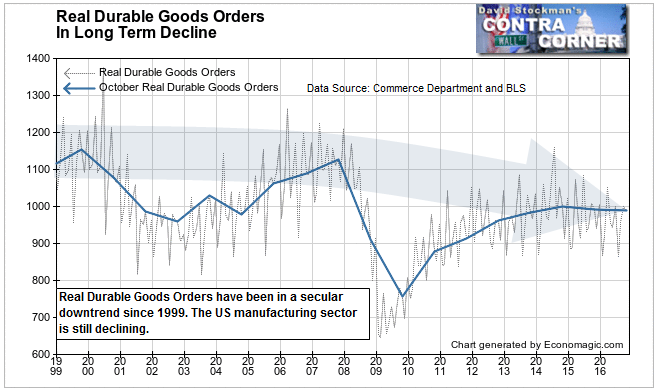
That’s a lot worse than the 1.3% gain shown by the nominal orders. That’s the only number that the mainstream media bothers to give you. Telling you that the volume of orders actually fell compared to last year just isn’t in their program.
This year to year shrinkage isn’t just a flash in the pan. The annual growth rate has fluctuated around zero since 2012.
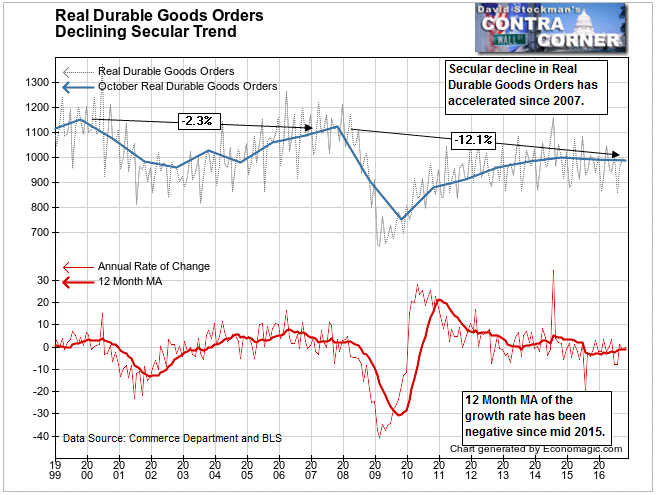
The 12 month moving average of the annual growth rate has now been persistently negative since mid 2015. That says that the US manufacturing sector is in recession. In the end The Wall Street Journal is dead wrong. The US manufacturing sector has not stabilized! It continues to slowly but steadily shrink.
Durable Goods Orders are just another data series that show that the US stock market has come unhinged. As an investor, you need to consider how long this condition can persist. The current rally may be the last best opportunity you get to lighten up on stocks and select a few shorts to protect your portfolio going forward.
Lee Adler first reported in 2002 that Fed actions were driving US stock prices. He has tracked and reported on that relationship for his subscribers ever since. Try Lee’s groundbreaking reports on the Fed and the forces that drive Macro Liquidity for 3 months risk free, with a full money back guarantee.

