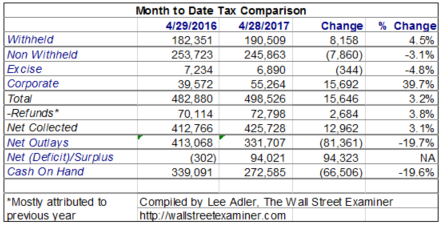
In the previous report on April tax collections we saw the huge surge in withholding taxes. It foreshadowed the surprise gain in the April jobs report. Don’t be surprised if there’s more of the same in May. The jobs report surveys are based on the week including the 12th of the month. The surge in withholding lasted through the end of April, and has continued in May. But make no mistake, at this stage of an expansion, “good news” is bearish. It will encourage the Fed to move to real tightening, not just the phony interest rate increases. Real tightening would mean shrinking the balance sheet.
The nominal growth rate in withholding in April was an astounding 11.4%. Adjusted for wage gains, that would suggest a real growth rate of around 9% for March. Over the past 3 months the average nominal gain has been +7.7%. That suggests a real gain of around 5-5.5%.
Those are stunning numbers. They tell us two things. First, Trump’s gambit of immediately spending all the $400 billion fund handed to him by the prior administration, worked. It goosed the stock market to new highs. It sent businesses into a frenzy of euphoric ecstasy that caused them to irrationally hire a multitude of new workers.
Meanwhile, other tax data tells us that the economy really isn’t doing so hot as employers keep adding scads of jobs in the expectation that all will be well. As we like to say, “Employers are always the last to get the news.” Or as economists would say, “Jobs are a lagging indicator.” For once, one of their pet ideas has substance.
Daily Treasury Statement Data
Withholding taxes for April from the end of month Daily Treasury Statement rose 4.8% versus April of 2016. That was despite having one less business day in the month, with collections ending on the 28th instead of the 29th as in 2016. This April had only 20 business days and one of them was a semi holiday, Good Friday. 2016 had 21 business days, and Good Friday and Easter were in March 2016 (I know this because I was in Rome for Easter weekend).
That explains why the year to year difference was smaller than the moving average method indicated. But considering the differences in the calendar effect, the increase would have been in the 9-10% range, which is still outlandish. I said last month that the gain we saw in March looked like an unsustainable burst of employer euphoria. Apparently it was sustainable through April. I believe that late May will begin to show signs of a hangover and that it will get worse from there. It will probably show up in the June jobs data. So stay tuned.
Excise taxes returned to their trend of weakness after a positive burst in March. Excise taxes are collected on a cross section of goods, suggesting that the US economy wasn’t so hot in April. It’s part of the reason I suspect that the job gains implied by the increase in withholding taxes can’t be sustained.
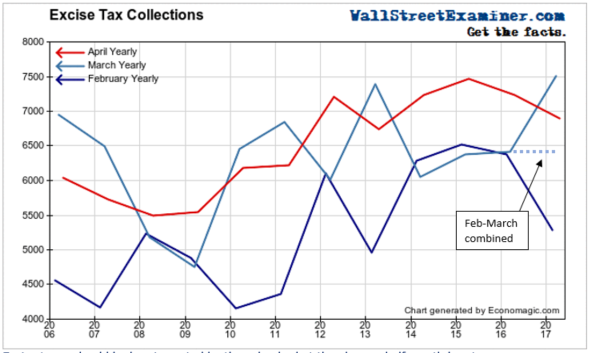
Excise taxes in April fell by 4.8% year to year. There were big swings in February and March that resulted in a year to year performance that was essentially unchanged for the 2 months combined. That followed declines of 2.6%, 2.9%, and 6.3% over the November-December period with similar declines going back to May of last year. The persistence of the negative numbers in this series raises real questions about the true underlying strength of the US economy.
These numbers tell us that the US economy has been weak despite the strength in jobs. The job gains are another instance of “Employers are always the last to get the news, because they take their cues from the stock market.”
The withholding and excise tax data are sending conflicting signals. Jobs related data should be stronger than expected but sales and production related data should be weak. The jobs data comes early in the month. The rest of the data comes later. If the jobs data does come in hot as the withheld taxes suggest, that should be bearish. It will confirm that the Fed will tighten. The market has been forewarned that we’re talking now about real tightening, that is, shrinking the Fed’s assets and sucking money out of the banking system. It is likely to be especially bearish for bonds. Bond investors will worry about signs that the economy is overheating, and that the Fed could be behind the curve on inflation.
With weaker data to come later in the month, might traders then then reverse course. I think not. Confusion, or what the media likes to call “uncertainty,” is usually an excuse for a selloff.
Individual Income Taxes on Small Business Sole Proprietors and Gig Workers
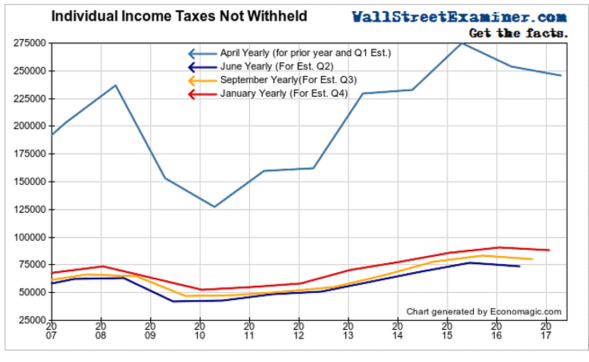
Non-withheld individual income taxes were collected in April. April collections include both underpayments for the prior year and estimated taxes for the first quarter. They were down about 3% year to year. We can’t tell how much of that was attributable to 2016 underpayments and how much was a reduction in estimated income taxes for the first quarter of 2017.
However, the decline continues a trend of falling individual income tax collections that has now persisted for 2 years. Small business are apparently continuing to shrink, probably even more than these lines suggest. Individual taxes include capital gains tax, and we know that there have been immense capital gains in the past year. If capital gains taxes were higher, then individual taxes from sole proprietors and gig workers are falling even more than shown. This is another sign that the surge in hiring indicated by withholding taxes is based on a delusional reading of the US economy by corporate employers.
Gas Taxes and Gasoline Demand
One of the largest components of Excise Taxes is the Highway Trust Fund tax on gasoline. That data is only provided in the Monthly Treasury Statement which comes out on the 8th business day of the following month. The latest data is for March. Like all excise taxes it is based on unit sales, not dollar value.
The gas tax was down almost 1% in March after being down 6.7% in February. That followed a decline of 1% in January, 12.5% in December, and 5.2% drop in November. Apparently, people are driving less. This is a sign that the US economy was not doing as well as the headlines had indicated. The aviation fuel tax is more of the same. Miscellaneous taxes are “sin taxes.” The majority are taxes on alcohol, tobacco, and firearms. Apparently people drank more and bought more guns.

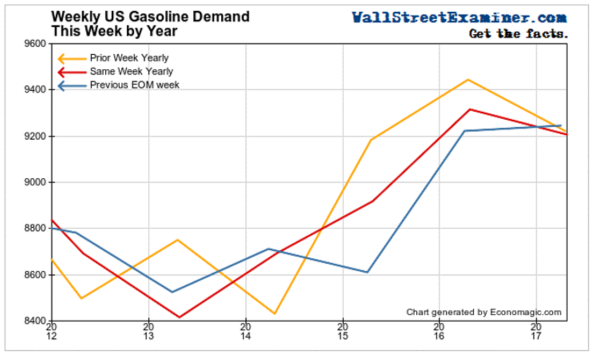
Returning to April data, the weekly data from the EIA for the week ended April 24 showed gas sales by volume down about 1% compared to the same week last year. The numbers had been persistently weak through the winter months as well.
Corporate Income Taxes
Estimated corporate income taxes for the first quarter are due in April. They were up nearly 40%, indicating a huge bump in corporate profits to a new record. The Trump bump showed up in the bottom line as businesses were able to extract higher profits in spite of weak sales.
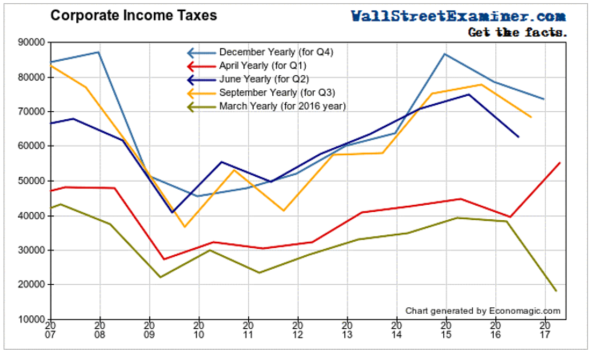
Higher returns on capital against weak revenue means that labor’s share of the pie continues to shrink. It may look good on corporate earnings statements for this quarter. But if the percentage of American workers who can afford to buy the goods and services produced by American businesses, over the long haul, that’s obviously bad for corporate bottom lines. That trend had been evident for the past 2 years. Given the fundamentals, and the ongoing signs of weak final sales my bet would be that this quarter’s surge in corporate profitability, and the stock market rally that has accompanied it, won’t be around for long.
This report is derived from Lee Adler’s Wall Street Examiner Pro Trader Federal Government Cash Flows Report.
Lee first reported in 2002 that Fed actions were driving US stock prices. The US Treasury has also played a role in directly moving markets. Lee has tracked and reported on those relationships for his subscribers for the last 15 years, helping to identify major turning points in the markets in their earliest stages. Try Lee’s groundbreaking reports on the Fed and the Monetary forces that drive market trends for 3 months risk free, with a full money back guarantee. Be in the know. Subscribe now, risk free!


