The mainstream media noted the weakness in auto sales early this month in their reporting on April data from the major auto manufacturers.
The Wall Street Journal reported:
Auto Makers Report Steep Sales Declines in April
The slowdowns raise the prospect that car companies may need to curtail production
Auto makers signaled their hot streak in the U.S. is rapidly cooling, as demand last month turned surprisingly sluggish for the trucks and SUVs that have fueled record profits for domestic players.
All correct, except for the fact that this is not something new. Sales have been weakening for a year. The financial media have only just noticed.
CNBC.com reported similarly:
Ford, Nissan, General Motors and Toyota all reported U.S. sales declines in April, strong signs that demand for cars, trucks and SUVs is starting to slow after seven straight years of growth.
They too missed the fact that sales have been declining for a year.
Contrast that to Bloomberg, which was less surprised and more accurate:
Auto Sales Fall for Fourth Straight Month
The market’s six biggest carmakers trail projections for April
‘All eyes’ on whether production cuts are enough, analyst says
The slump in the U.S. auto industry is showing no signs of letting up.
Bloomberg, to its credit recognized and reported that the slump is not new, and is not getting better.
Auto and light truck sales, which includes SUVs and pickups, also known as Light Motor Vehicle sales are one of the most useful economic series for investors to watch. The are a measure of final sales, and they come almost in real time, immediately after the end of the reported month. Whereas data like nonfarm payrolls and durable goods orders are miracles of government statistical massage, vehicle sales are hard data.
In addition, jobs data, like the data on business investment which I covered in my last post, are lagging indicators. Businesses make hiring and investment decisions on the basis of rank speculation about the future. Then it takes time to implement those decisions and actually spend the money to buy the equipment and build the projects.
In the absence of actual sales pushing them to expand production, and hiring, and capacity, they base their decisions on speculation. And the stock market is usually the driver of that speculation. We have all been taught that when the stock market is high, it must be good times. Unfortunately, the opposite is true after long periods of rising stock prices. That rise usually hides a multitude of sins. The stock market is the lipstick. The economy is the pig.
Unlike jobs data and business investment data, measures of sales like auto sales, retail sales, and particularly real time Excise Tax collections and EIA data on gasoline demand, tell us exactly what consumers are doing–how much they are buying. When business manufactures more than what consumers are buying, then businesses must ultimately cut production. Likewise when businesses overinvest relative to current sales, they get stuck with excess capacity. That exerts a longer term negative drag on the economy.
That brings us to a point where business is producing too much and expanding capacity beyond what can be absorbed by the market. And that, if allowed to continue, leads to financial crisis. The excess production and speculative development projects fail to produce sufficient income to service the debt that financed them. Loans start defaulting. Banks get in trouble. Etc.
When business people deny the reality of the market place, and continue to invest in hiring excess workers and investing in excess plant and equipment, that’s a bubble. The longer the behavior goes on, the bigger the bubble. The bigger the bubble, the greater the risk, and the more severe the ultimate adjustment.
That’s the process we’re in now. We’ve already shown that stock prices are even more out of whack than real business investment. So the risk to financial assets has both operational and financial leverage. It is gargantuan.
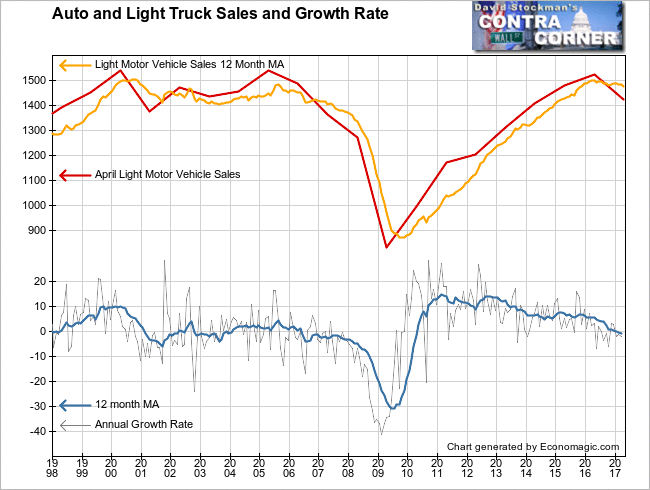
That brings us to the auto sales figures. Just as we’ve seen with Excise taxes, including gas taxes, and with EIA gasoline demand, light vehicle sales have been decaying. We need not get into a thousand words on the data, a picture will tell the story. Total sales are down sharply year to year, with a 4.7% decline. That’s faster than the decline of the 12 month moving average, which has just gone negative. Sales growth has gone from multiple peaks near 30% in 2012, to persistently negative for the past year.

In addition, sales peaked at about the same level as they did in 2000 when the last internet/tech bubble peaked, and in 2005 as the housing bubble reached peak equity extraction. After 7 years of expansion by 2016, sales had still not surpassed the peak of 2000. Yes, sales are the same, but the US has 44 million more people.
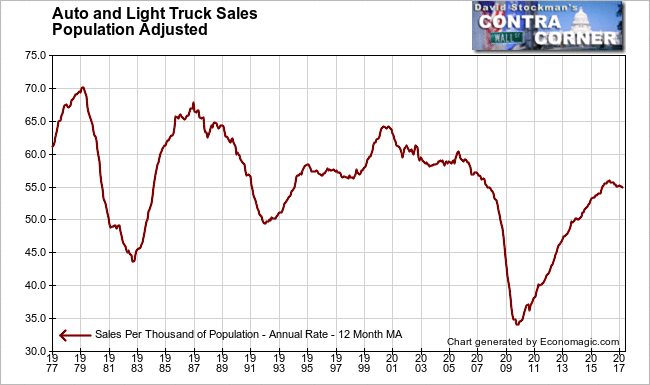
When we divide sales by population, we see a picture of an economy that has continually weakened over the long term as fewer and fewer consumers can afford the purchase of an automobile. Auto sales per thousand persons today are far lower than they were at the 2006 housing bubble peak. They are even further below the 2000- peak. That peak was in turn below the 1986 peak. And that in turn was lower than the 1979 peak. In each successive recovery fewer people have bought cars. That’s a picture of the decline hollowing out of the American middle class. An ever poorer population can’t support an ever growing economy, and the trend has clearly worsened over the past 18 years.

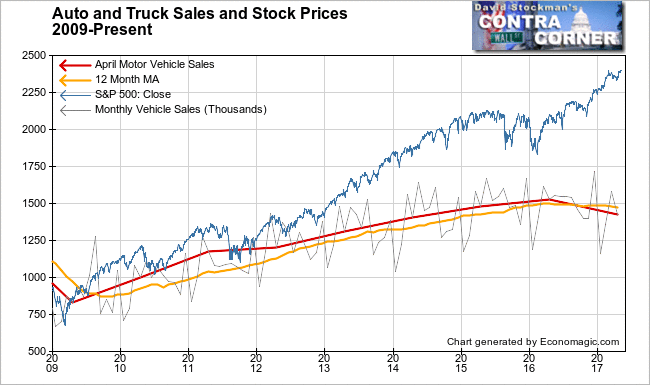
Comparing auto sales to stock prices shows very clearly that the trickle down theory that Ben Bernanke enunciated to justify the Fed’s QE money printing operations has not worked. Yes, it has enriched stock owners, but the rest of the public has fallen behind. The growing divergence between soaring stock prices and stalled auto sales clearly illustrates the point.

This is not a happy trend. It will not have a happy ending. The Fed knows the economy is weakening, but it is also finally worried about asset price inflation. We now know from the Fed’s meeting minutes and the speeches of Fed movers and shakers that the Fed now wants to thread the needle between an asset bubble and a weak economy. It will begin to shrink its balance sheet. It has decided that it will accept a certain level of pain in stock prices. The handwriting is on the wall for the end of this mania. It’s time to tighten your stops.
Lee first reported in 2002 that Fed actions were driving US stock prices. The US Treasury has also played a role in directly moving markets. Lee has tracked and reported on those relationships for his subscribers for the last 15 years, helping to identify major turning points in the markets in their earliest stages. Try Lee’s groundbreaking reports on the Fed and the Monetary forces that drive market trends for 3 months risk free, with a full money back guarantee. Be in the know. Subscribe now, risk free!


