A well known sports talk show host’s trademark is screaming, “ARE YOU KIDDING ME?”
Yesterday’s Wall Street Journal headline on Industrial Production fits into that niche. Ben Leubsdorf, “ARE YOU KIDDING ME?”
U.S. Industrial Production Flat in Warmer-Than-Usual October
Utilities production dropped sharply, offsetting modest gains in factory output
Maybe he didn’t write that headline, but it perfectly encapsulated the gist of the headline. If it just wasn’t for that ultra warm OCTOBER weather, with that yooge drop in electricity production, everything was hunky dory. “Industrial output was flat in October, as unusually warm weather depressed demand for home and office heating, but the U.S. manufacturing and mining sectors showed continued signs of stabilization,” wrote Leubsdorf.
Now I admit to being biased against Leubsdorf. He rubs me the wrong way. Reporters who persistently imbue economic data with demonstrably false positive spin tend to do that to me. I am not a patient person with lying, clueless, incompetent, financial propagandists.
Recently the Wall Street Journal offered all its reporters a buyout. The Journal apparently wants to turn its “news” production over to programmable artificial intelligence run by the Journal’s parent, News Corp’s News America Marketing, whose slogan is “Your marketing objectives are our business.” Take the buyout Ben. Do us all a favor. I’d rather read a webbot.
Let’s get to the facts. Since Leubsdorf made this about the weather, let’s talk about the weather. The average temperature in the continental US in October was 57.74 F, according to the National Oceanic and Atmospheric Administration. That’s nice weather. How much warmer was it than last October? A half degree on average. A half degree! In percentage terms it’s a 0.9% difference. File that in your memory bank for a minute. We’ll need it further along.
The average temperature data is based on the average of the 48 contiguous US states. There’s no weighting by population or number and size of businesses or the distribution of industrial production around the country. The empty, agricultural Great Plains, count for just as much as heavily populated, highly industrialized California.
So what about California, our most populous state, with the highest concentration of US industry, contributing 13.9% of US GDP? According to NOAA, California’s average temperature in October DROPPED 4.5 degrees from last October. Did that decrease electricity consumption?
Texas is the second largest state in both population and GDP. It accounts for 8.7% of US production. Most of Texas is probably still running the air conditioning during the day in October. It’s average high temperature rose by 2.4 degrees to 84 degrees. More AC please!
Admittedly, the Northeast, which accounts for about 24% of US GDP, was warmer than last year, but still well within the normal range. It also means that the need for less heat generation was partly offset by more warm days where the AC was needed.
The warm Southeast accounts for nearly 22% of US GDP. It was a LOT warmer than normal, in fact near and all time high. The average daily high temperature was 79.5 degrees, up 4.4 degrees from October 2015. People never run the heat in October in the South for heaven’s sake. But this year they sure needed to pump up the AC. That would contribute to more electricity production, not less.
Ditto for the Southwest, which accounts for 12% of US production. Temperatures there rose to daily highs averaging an absolutely unbearable 73.3 degrees from a frigid 69.9 degrees. Impact on heat or AC generation? Pick a random number between -0.1 and +0.1.
Now, I’m not going to go to the length of calculating the average temperature change weighted by industrial production. Just consider this. Who the hell in the US uses electric heat in areas where heat is needed in October. I’d venture to say no one. A slightly warmer October might increase heating oil or natural gas usage, but it sure wouldn’t impact electricity usage. It’s just nuts to say that it would.
Even if people in colder regions did heat with electricity, suffice to say that the changes in temperature would be largely offsetting in terms of their effect on whether or not people needed less heat this year.
Furthermore, electricity production comprises just 10% of the US Industrial Production Index. Even if the half degree difference in the national average applied equally across the economic spectrum the impact on the total index would be +0.09% on a year to year basis.
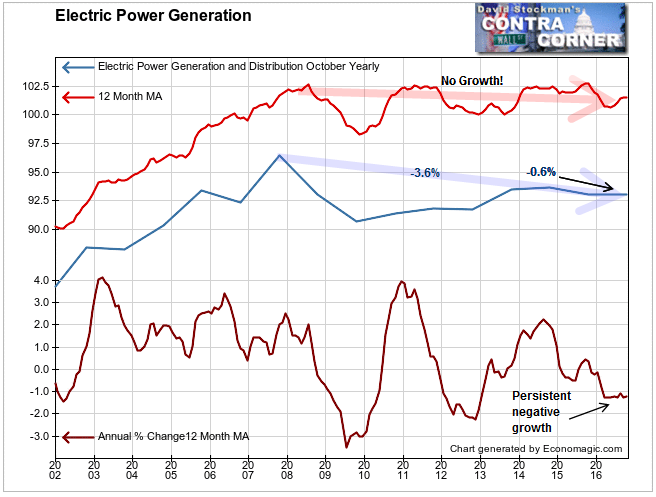
This decline in Electricity production isn’t normal and it isn’t due to the weather. US population is always growing. Electric power use should be growing at at least the same rate as population, and more than that to indicate economic growth. In fact, electric power generation had been persistently uptrending in the 33 years in which this data had been collected prior to 2007. Then it just stopped. This is just one more sign that the US has been a no growth economy since 2007. Does that justify stock prices being 38% higher since then?
The total year to year change in the IP index was -0.9%. So even if you add back the difference that the weather probably didn’t make, the net change in total IP year to year would be -0.8%, hardly material. Most importantly it’s still negative, as the number has been throughout this year.
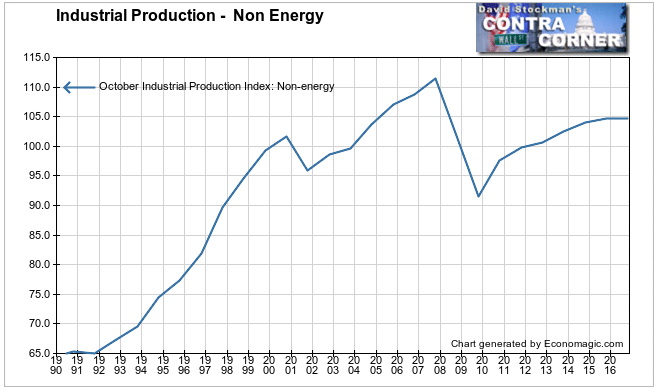
One more test of the thesis that Industrial Production would be just fine if not for the weather is to look at total industrial production excluding Energy. Energy includes electricity generation and oil and gas production, which have been shrinking since 2014. Non Energy IP looks like this.

Does that look ok to you? In a country whose population grows at 1% per year, flat production over the past 2 years is not ok and a 7% decline since 2007, is really not ok.
Leubsdorf’s clueless spin is useless. The US Economy is weakening, and the long term trend of both electricity production and non Energy IP are evidence of secular decline. This so called “recovery” has been anything but. The rise in stock prices is resting on thin air. At this stage of the advance, the name of the game is “capital preservation.”
Lee Adler first reported in 2002 that Fed actions were driving US stock prices. He has tracked and reported on that relationship for his subscribers ever since. Try Lee’s groundbreaking reports on the Fed and the forces that drive Macro Liquidity for 3 months risk free, with a full money back guarantee.


