On a day when the Fed will likely overshadow everything with unearned attentiveness, the BLS released its annual benchmark for the Establishment Survey. Actually, it was just the preliminary estimate for the coming benchmark revision, which was curiously downward. It bears repeated that the BLS does not estimate the total count of either employed persons or payrolls but rather each monthly release is but a stochastic simulation of the “likely” variation. This is not inappropriate, as the ability to collect and distill surveys and data and match them against broader inventories is quite limited. What is not appropriate is the certainty each monthly number is given by economists and then the media.
Almost all employers in the US are required to file an employee count for March each year, which provides the opportunity for the BLS to match its numbers against what it can glean from the state UI filings. This is the first of the annual benchmarking process, in arrears, but it bears emphasizing that it is not the last as even here sampling processes and incomplete data “requires” statistical modeling to aid in the “final” number.
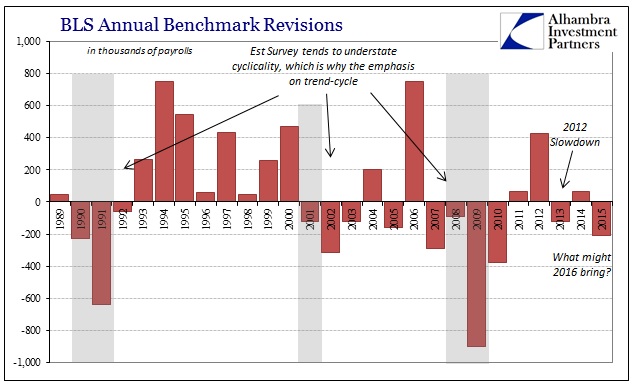
The history of these annual revisions offers a limited interpretation on just the sort of trend-cycle issues that have plagued so many other data points. If you review that chronology, the trend-cycle variation stands out as large – especially in recessions the past quarter century (all three, so far). You find, as you might expect given trend-cycle influence (almost always a positive bias, with the exception of 2005, until outright recession proves otherwise), there are negative revisions clustered around contraction; before, during and after. Likewise, positive revisions suggest closer to cycle peaks or strong points.
The bottom of the 1990-91 recession was revised down by more than 600k, while the trough of the Great Recession saw the employment count reduced by nearly 1 million (these annual revisions are retroactively applied to each month within the yearly timeframe; that is what we don’t know of 2015’s revision and won’t until next March when the new benchmark is “wedged” into the prior series). To see a -208k benchmark for 2015 raises the issue about what kind of economic environment existed earlier this year. The Establishment Survey was showing very strong growth, to be sure, and this isn’t a large negative but it already suggests the same criticism about over-optimistic subjectivity during that period (the same interpretation is applied to the negative revision for March 2013 and how the 2012 slowdown has only been revealed to these numbers and others like GDP years afterward).
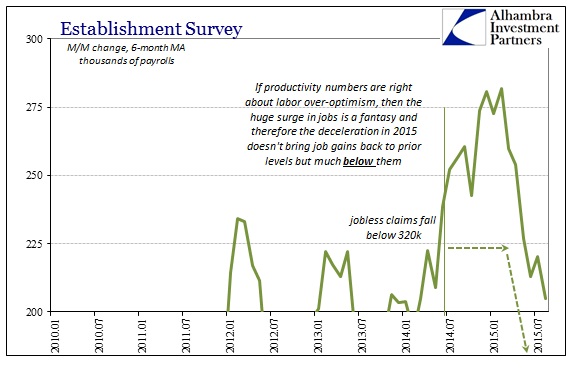
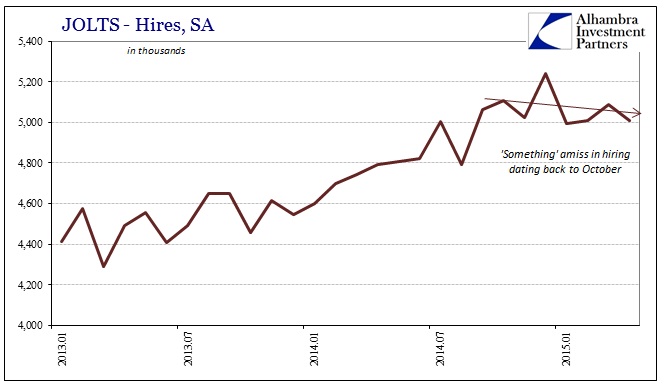
The impact of this single revision is not large, nor should it be, only in the context of the divergence between what the mainline numbers (like GDP and the unemployment rate) say about the economy and what everything else suggests, especially when it is those more “acceptable” figures that constantly have to be scaled back when trend-cycle estimates are finally matched with broader and less subjective data. More importantly, what might that set up for the next benchmark revision for March 2016? After all, as I have noted all year, even the Establishment Survey has already slowed considerably. That is what I think is most relevant to this benchmark revision, again that it offers another minor suggestion that that deceleration may be worse than it appears. We will have to wait until next September to find out that the BLS’ ideas about where the economy in the cycle just weren’t appropriate (again).
Of course, if that is correct by then we won’t need the BLS to show us what would already be very apparent – it just won’t be “unexpected.”


