Following the balance sheet data from the Fed’s weekly H.4.1. and H.8 reports can be like watching grass grow for long stretches. I have pored over this data for 15 years and have sometimes wondered, “Why bother?” The answer is that over time we can note subtle changes in pattern that lead or reveal the changes in the season of the market. Right now is one of those times.

Bank loans edged to another new all time record in late October. The growth rate has been between 7% and 8.5% since December 2014. And yet, mainstream economists don’t seem to be worried that this might be another bubble, just like the other bubble. In fact, we keep hearing complaints that loan growth is too slow. Think about that. Bank At the same time, GDP growth is pegged at +1.5%. Since it’s not miraculously spurring massive growth, where’s all that credit going?
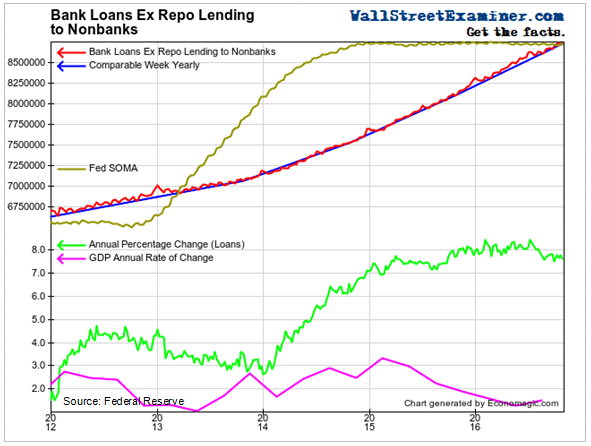
Lending not related to financing securities holdings has continued to plow to new highs. This includes both consumer lending and commercial and industrial lending. The growth rate of these loans continues to hover around +7.5% to 8%, where it has been since early 2015. Pundits who complain about weak lending or slow credit growth are kidding themselves.
The Fed stopped printing QE money at the end of 2014, but loan growth remains overheated. How do we know it’s overheated, and essentially useless? Because while the annual rate of loan growth has surged from under 4% to around 8% since early 2014, GDP growth has slowed to under 2% today.
The BEA’s quarterly annualized headline GDP number has fluctuated wildly. The BEA had reported a 5% growth rate in 2014, and over 3.5% in a recent quarter. That was an artifact of making seasonal adjustments and then annualizing whatever error is inherent in the quarterly number. Their number is currently 2.9%. While that’s the number that media reporters and Wall Street pundits focus on, the truth is that the economy has been decelerating since Q1 2015. GDP growth peaked at about +3.3% in that quarter, and has been downtrending since.
So much for the theory that tight credit was holding back growth. Like most economic theories, there’s no support for it. In fact, increasing debt seems to be holding back growth. Doesn’t that seem to make sense? Rising debt becomes an increasing burden against future production.
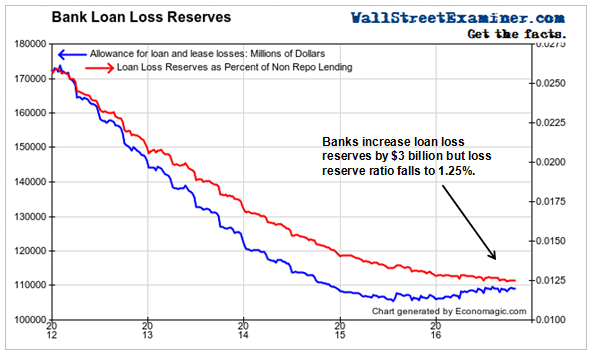
As loans outstanding have soared and GDP growth has slowed, you would think that bankers might recognize the increasing risk and set aside a bit more in reserves. But they haven’t seen it that way. They cut loss reserves from $170 billion to $106 billion between 2012 and mid 2015 . Since then they rebuilt reserves by a mere $3.6 billion, while non repo loans grew by $753 billion (not a typo).
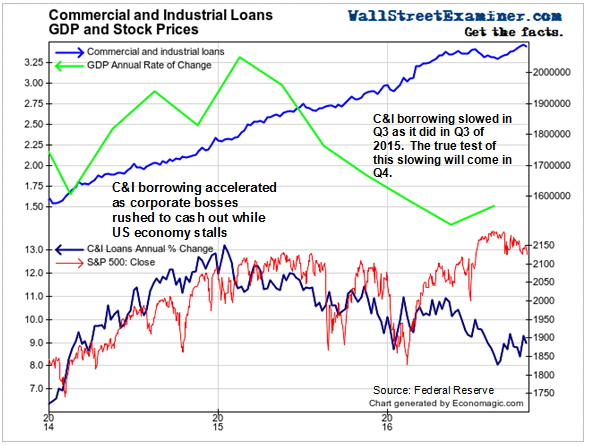
Commercial and Industrial lending growth slowed in the third quarter, dropping from more than 13% in early 2015 to around 8%. But in October the growth rate ticked back above 9%. That’s still a very hot growth rate. Meanwhile data on real business investment in plant and equipment continues to shrink. Bankers may be confident in their future prospects, but their biggest customers apparently are not, as they continue to cut back on real investment.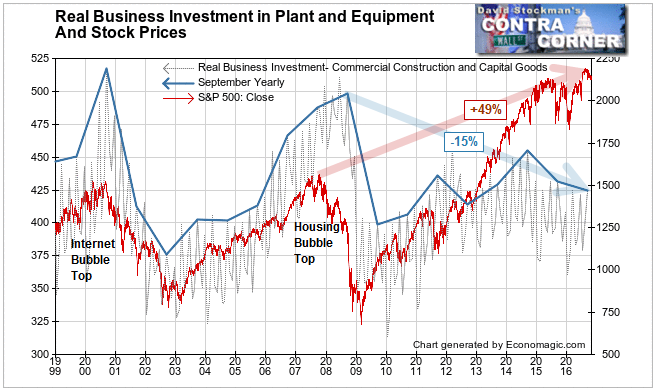
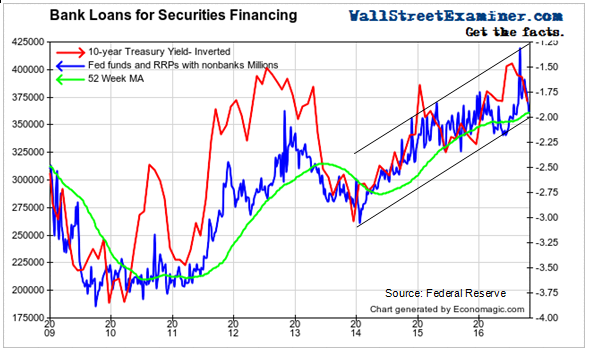
Repo loans to nonbanks to finance carry trades and other securities holdings spiked to an all time high in mid September, then plunged back to the bottom of the uptrend channel almost as quickly. The plunge was accompanied by a sharp fall in Treasury prices and rise in yields. A drop below $325 billion could mean the end of the bond bubble.
Money supply maintained its rapid growth in October, with the annual growth rate rising to 8%, the fastest growth since a brief surge at the end of 2012. There’s usually a surge in money supply from July until April of the following year and some softness in the summer. This year the summer slowdown was not as deep as last year, leading to a stronger growth path for the year as a whole so far.
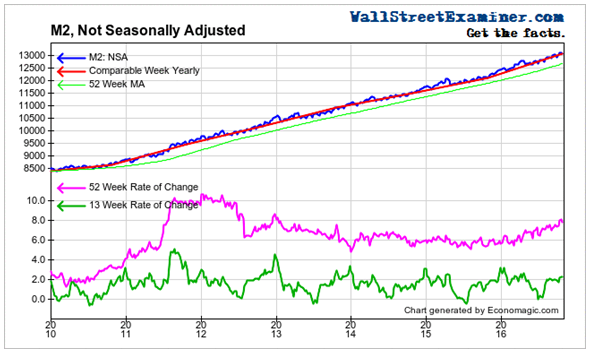
Money supply tends to expand rapidly in the early stage of recovery when the Fed eases aggressively. In the later years of an expansion the Fed usually gradually tightens and the growth rate of money slows. But in the last 3 years of the housing bubble, money growth began accelerating again.
A similar pattern has been happening since the second half of 2015. This suggests bubble dynamics are at work. The Fed hasn’t tightened yet. Speculative behavior has been raging. Speculative lending is growing rapidly. This is unhealthy and will lead to a massive adjustment, most likely beginning within 6-12 months if the past pattern is any guide.
This report is excerpted from the Wall Street Examiner Pro Trader Macroliquidity service. That report looks at the balance sheet of the Fed and US commercial banks and secondary banking and financial indicators that tell us about the condition of the financial system and can give us clues about the future. It is published monthly.
Lee Adler first reported in 2002 that Fed actions were driving US stock prices. He has tracked and reported on that relationship for his subscribers ever since. Try Lee’s groundbreaking reports on the Fed and the forces that drive Macro Liquidity for 3 months risk free, with a full money back guarantee.


