
In last week’s missives, I discussed the potential for an oversold, short-covering bounce which was to be used to further rebalance portfolios and reduce equity risk. The target zone was 1940 to allow for the completion of the “risk reduction” process.
“That rally could take the markets back to the previous resistance of 1940 (about a 4% push) from current levels. Such a rally would be enough to suck many of the “bulls” back into the markets pushing markets back into overbought territory and setting up the next decline.”
Chart updated through Friday’s close:
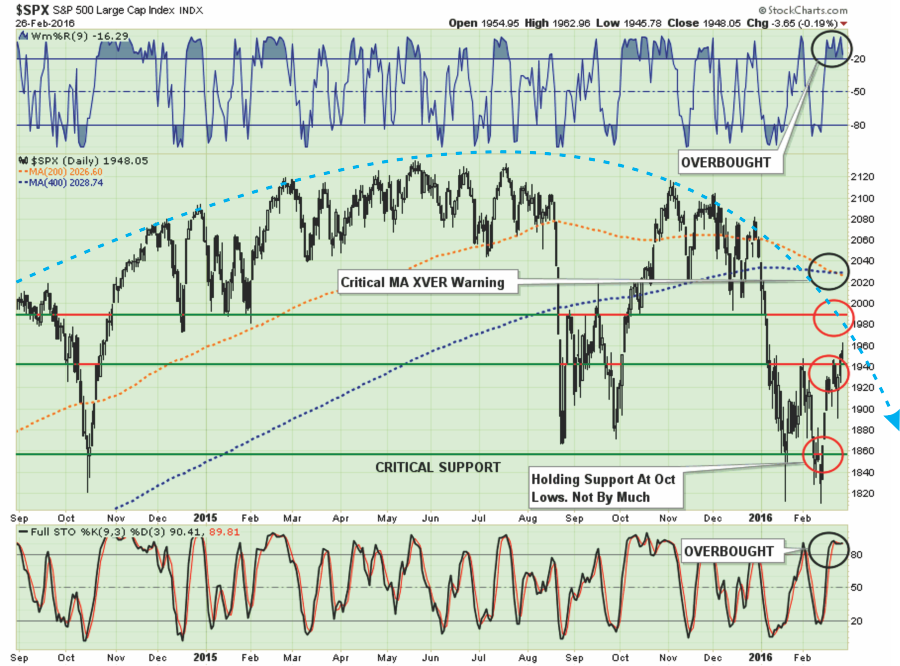
The good news is that the market was able to break above 1940, and the 50-dma, which now clears the way for a push to the 1970-1990 where the next levels of resistance will be found.
The bad news is that the markets are once again extremely overbought and still confined inside of an overall downtrend.
Importantly, as I predicted last week, the 200 and 400-dma has crossed into bearish territory for the first time since the financial crisis. While such a “cross” is not necessarily a signal of the onset of a new cyclical bear market, it does apply yet another level of downward pressure on stock prices.
The next chart lays out the most probable path of the current bull rally within the confines of an overall bearish trend.
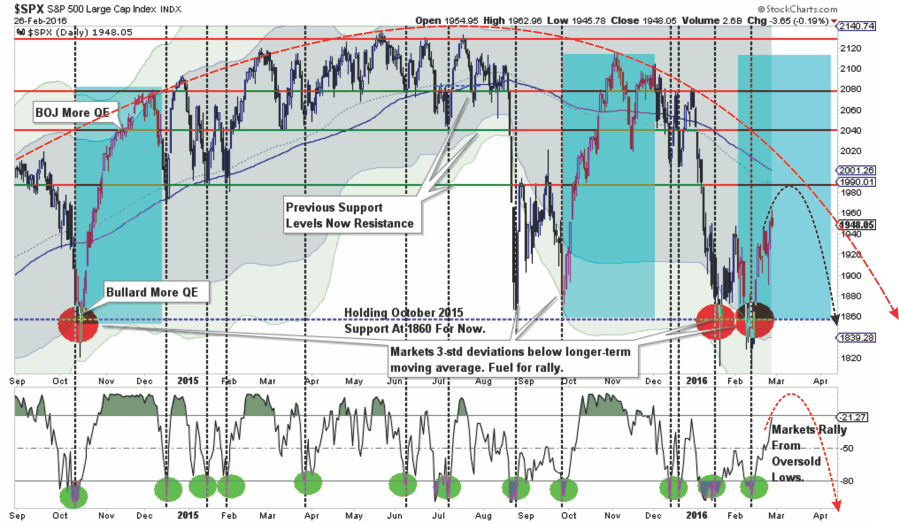
There are quite a few moving pieces here, so let me explain.
- The shaded areas represent 2 and 3-standard deviations of price movement from the 125-day moving average. I am using a longer-term moving average here to represent more extreme price extensions of the index. The last 4-times prices were 3-standard deviations below the moving average, the subsequent rallies were very sharp as short-positions were forced to cover. The vertical blue bars show the previous two periods where bulls regained footing and pushed markets from lows towards new highs. The current setup is indeed similar to those previous two attempts. All we are lacking is some serious “jawboning” from a Fed official about accommodative support to push markets higher.
- The bottom of the chart shows the overbought/sold conditions of the market. The vertical dashed lines show that oversold conditions lead to fairly sharp rallies. The recent rally, while the “best rally of the year,” has responded as expected from recent oversold conditions. With the oversold condition now exhausted, the potential for further upside has been reduced.
- With the 125-day moving average trading below the 150-dma, and with both averages declining rather than advancing, the easiest path for prices continues to be lower as downward resistance continues to be built. The arching dashed red line shows the change of overall advancing to now declining price trends.
As I stated, such an advance would correspond with a rally within the ongoing downtrend and sets the markets up for the next retest of recent lows.
But that is must my opinion. There were some really good confirming bits of technical analysis out this past week as well worth sharing with you.
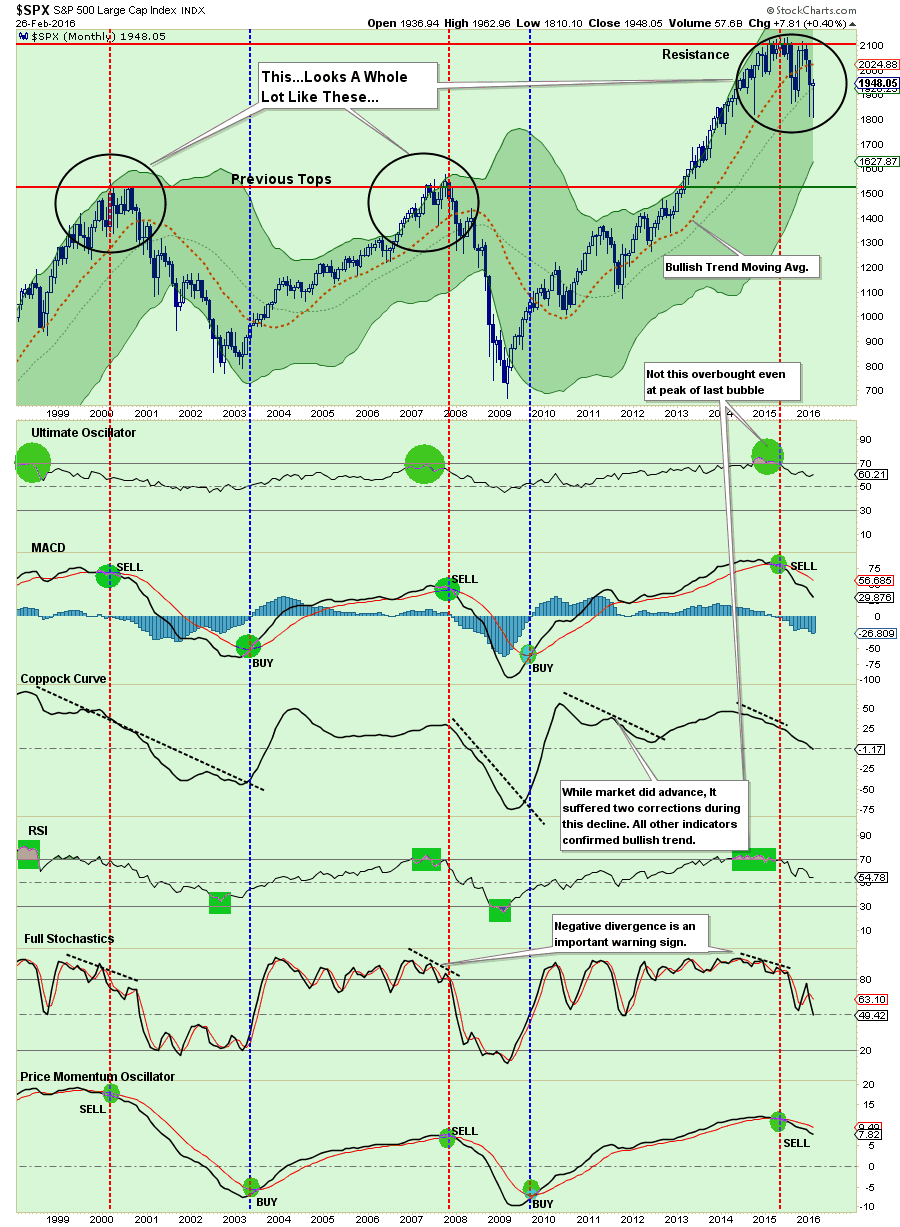
NO BREAKOUT FOR THE BULLS
Northman Trader had an interesting technical post on Friday showing the technical breakdown of the market from several perspectives. The first, as shown below, is that while the markets closed below the important 1950 level, it did manage to stay above the 50-dma but just barely.
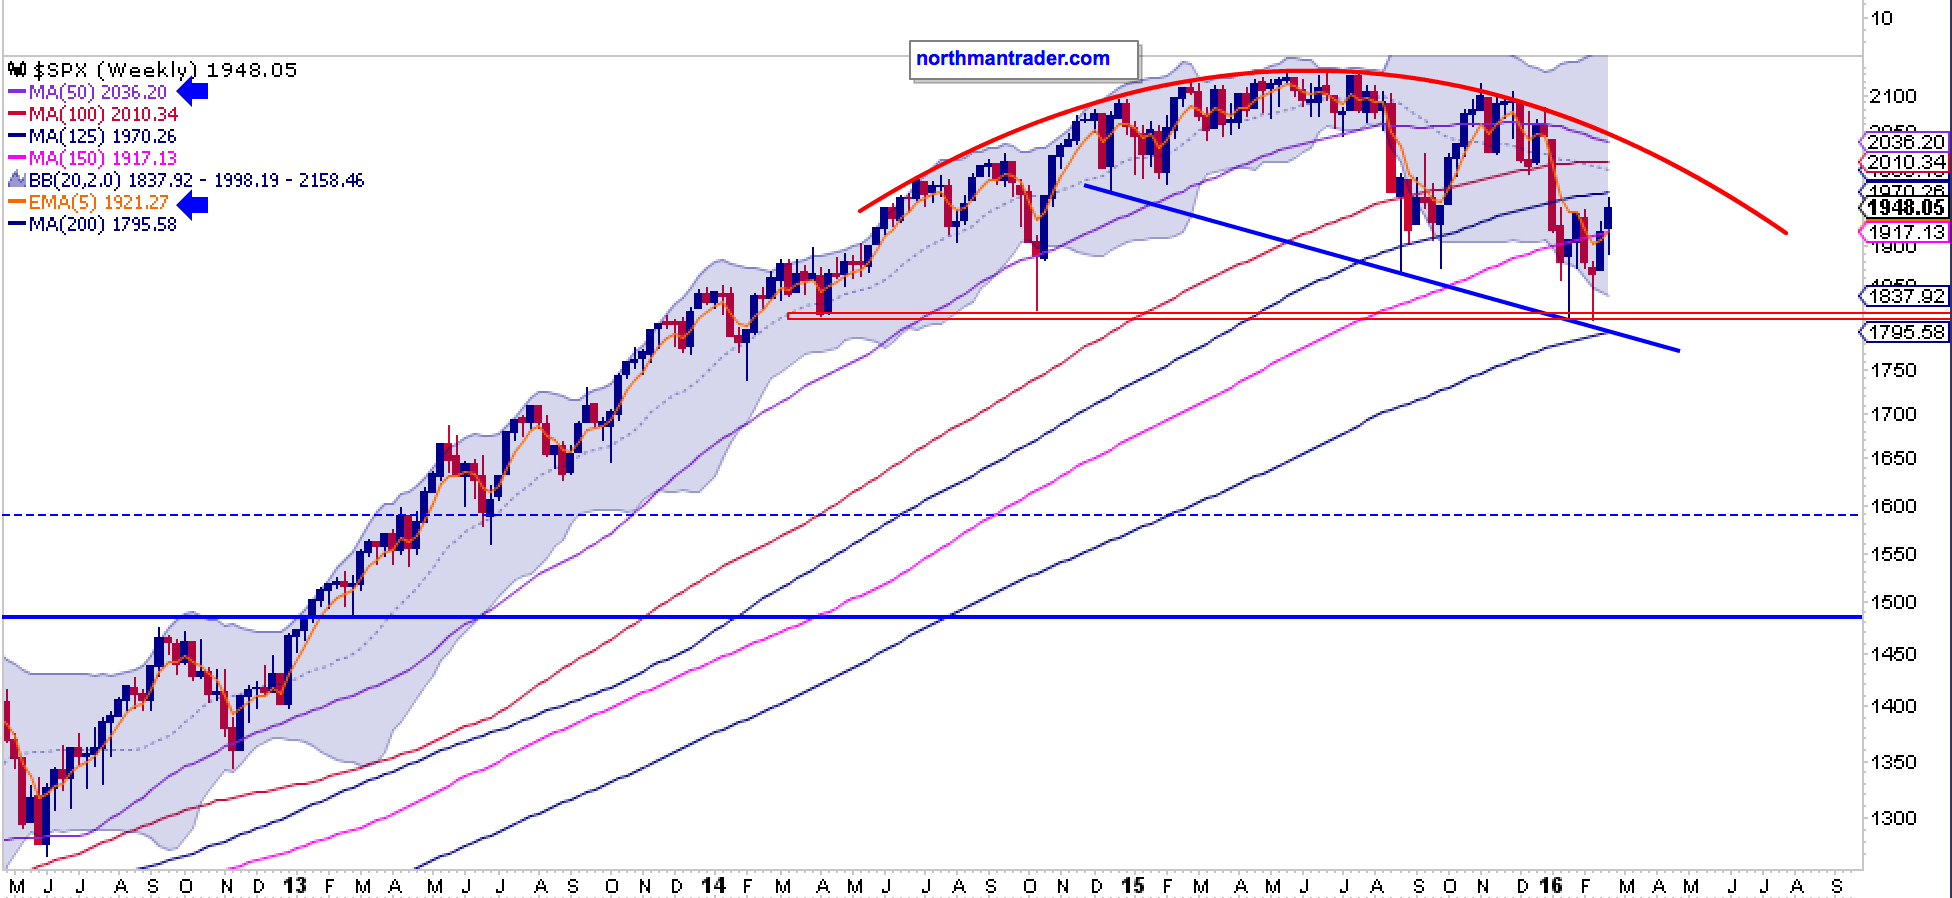
Importantly, Northy also noted the topping pattern I discussed above along with the critical support levels going back to March and October 2014 lows.
But here is the most important point he makes:
“$SPX monthly chart: Unless the $SPX has a miracle rally on Monday it will close the month not having touched its monthly 5 EMA from the underside for the first time since 2009:“
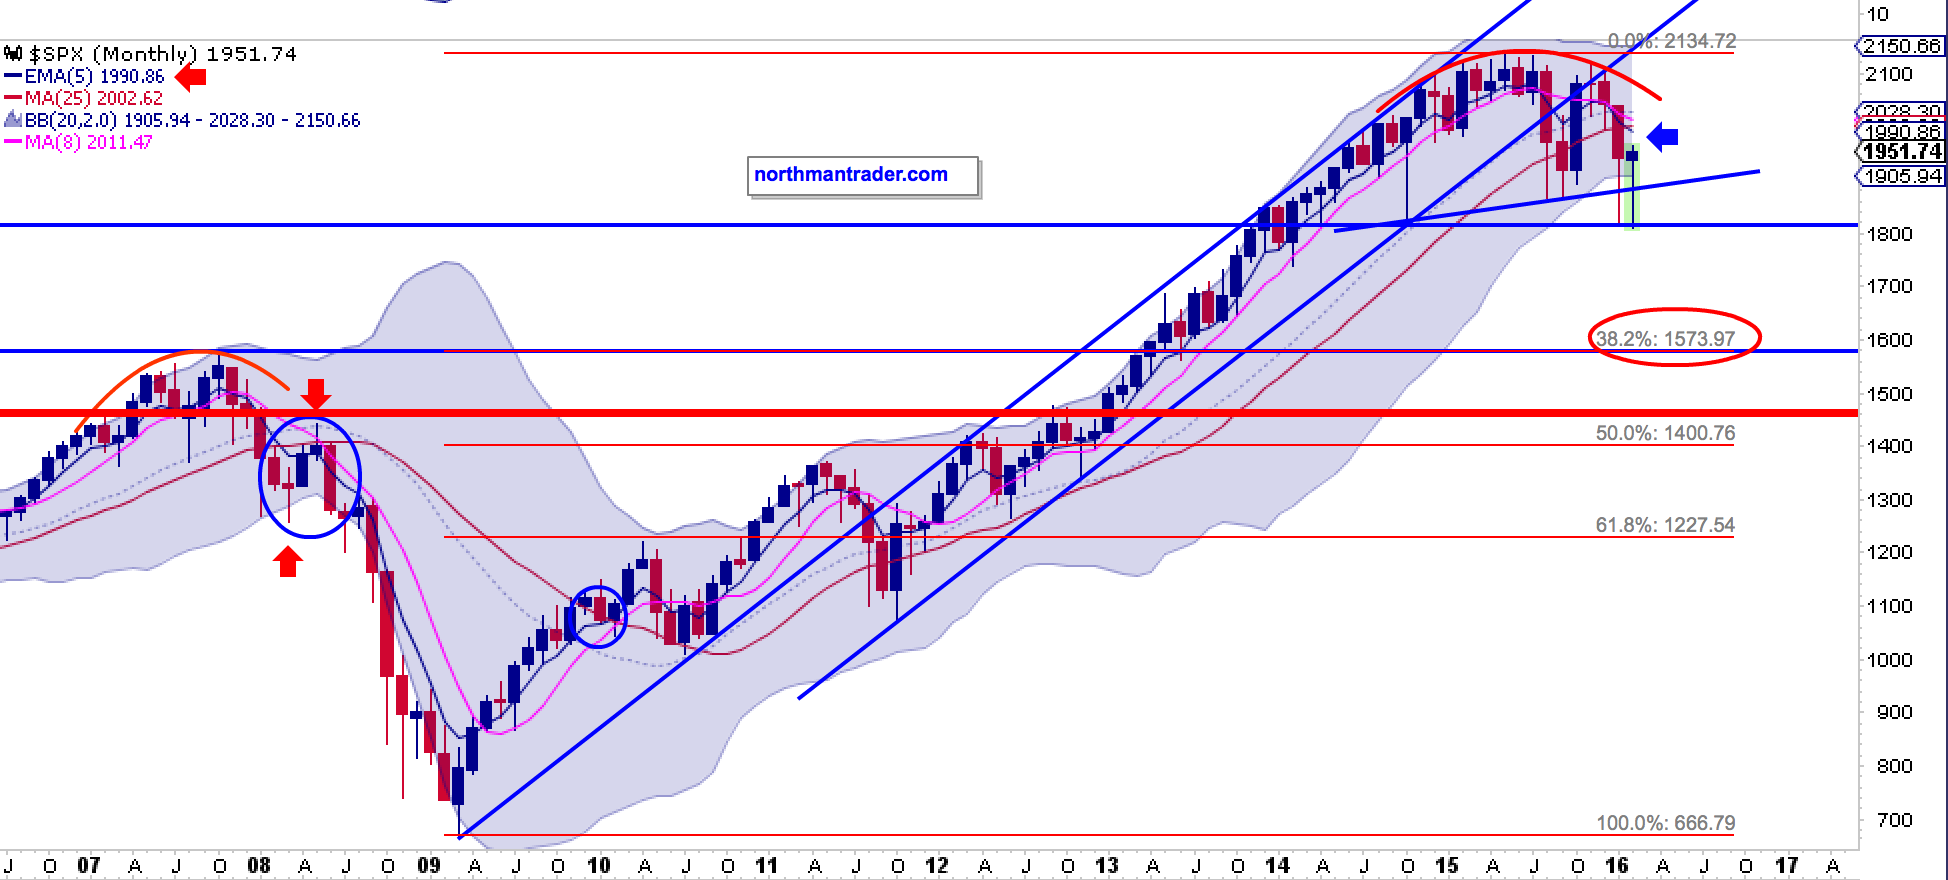
What Northy notes in the chart above is the same message I have discussed over the past couple of months. That message is simple:
“The market is currently suggesting that the bull market began in 2009 has now come to its inevitable conclusion.”
THE PERFECT STORM
Erin Heim from Decision Point, recently penned an excellent analysis also suggesting that the recent bull rally is NOT the beginning of a new bull market cycle. To wit:
“Indicators in all time-frames don’t always coordinate with each other, but I believe they are beginning to meld right now. I noticed each time-frame was becoming extremely overbought.
The first chart shows the On Balance Volume Indicator Suite made up of the Climactic Volume Indicator(CVI), Short-Term Volume Oscillator (STVO) and the Volume Trend Oscillator (VTO). As I said, they don’t often peak at the same time. Dragging a vertical line across the chart, I marked overbought readings peaking at the same time. The result? A price top. But wait, it’s important to point out the green line. There are undeniable similarities in price pattern and indicators that preceded another leg up. However, note volume behavior (blue lines). There is a distinct difference. Volume stayed fairly even during the preceding rally and in this case, volume has been drifting lower.“
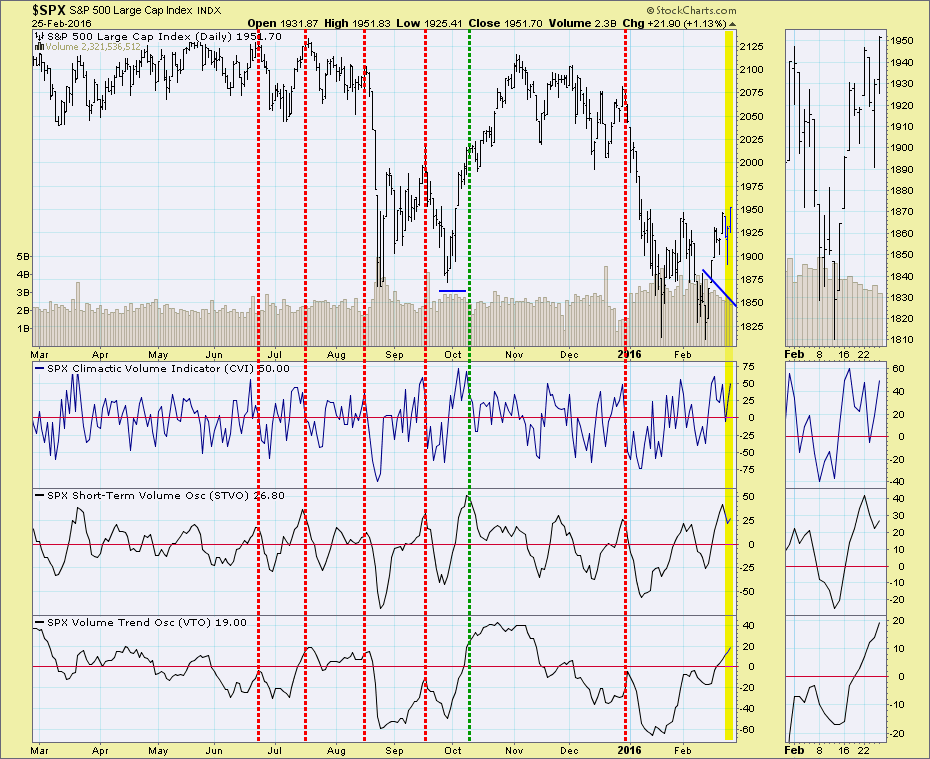
“Here’s a three-year chart using the Price Momentum Oscillator (PMO), Swenlin Trading Oscillator – Breadth (STO-B) and Intermediate-Term Breadth Momentum Oscillator (ITBM). These indicators don’t line up very often. The last yellow bar uses a short-term overbought peak for the ITBM with the same result.”

“Conclusion: When all three time-frames become this overbought at the same time, we usually see a correction or sizable decline. Last time on the CVI/STVO/VTO chart, it was a continuation rally; however, volume decreasing on the current rally indicates a decline is more likely.”
A CHILLING FORECAST
My friend and colleague, Michael Lebowitz from 720 Global Research, sent me this note on Friday. You will note many similarities to what I have been writing over the last several weeks.
“In this article, we highlight a simple technical indicator that has proven prescient over the last 15 years. Currently, this indicator supports much that we have posted regarding equity valuations and what they portend for the future direction of prices.
Moving Averages
Moving averages are the average price at which an index or security has traded over the last number of days, weeks, months or even years. For instance, today’s 20-day moving average for the S&P 500 is its average closing price over the prior 20-days. Many investors use moving averages to help gauge where a security or index may encounter support or resistance. Due to the widespread use of moving averages, it is not uncommon to see prices gravitate toward moving averages.
Another way investors employ moving averages is to compare them across different time frames. For example, an investor may compare the 20-day moving average to the 50-day moving average. It is said that when a shorter term moving average is higher than a longer term moving average the underlying stock or index has positive momentum and vice versa. Therefore, when short-term moving averages cross to the upside or the downside of longer term moving averages it can signal an inflection point where momentum has changed direction.
20/10
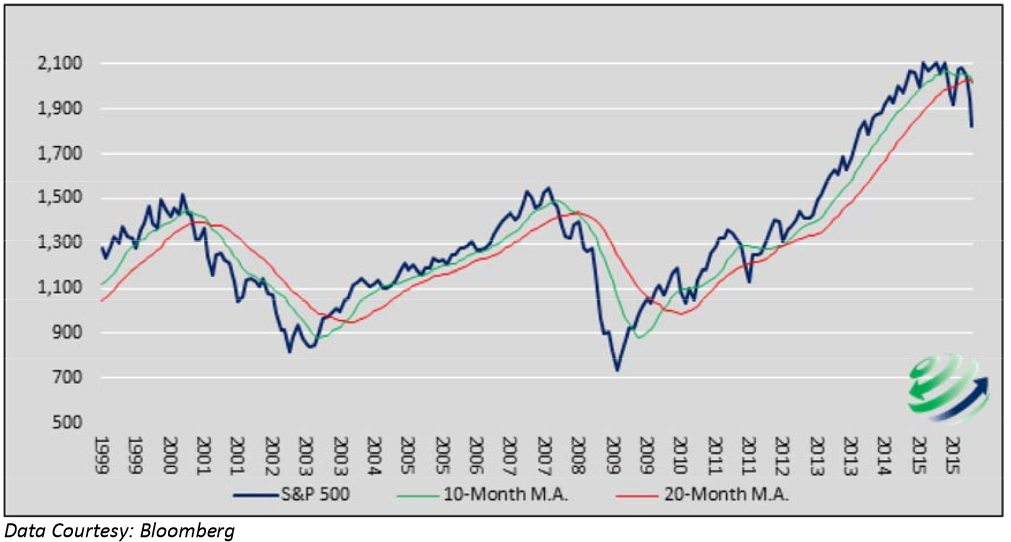
The indicator that is currently catching our attention, and may be worthy of your attention, is a comparison of the 10-month and 20-month moving averages on the monthly S&P 500 index. Monthly moving averages are similar to the aforementioned 20-day example but instead of daily closing prices, monthly closing prices are used.
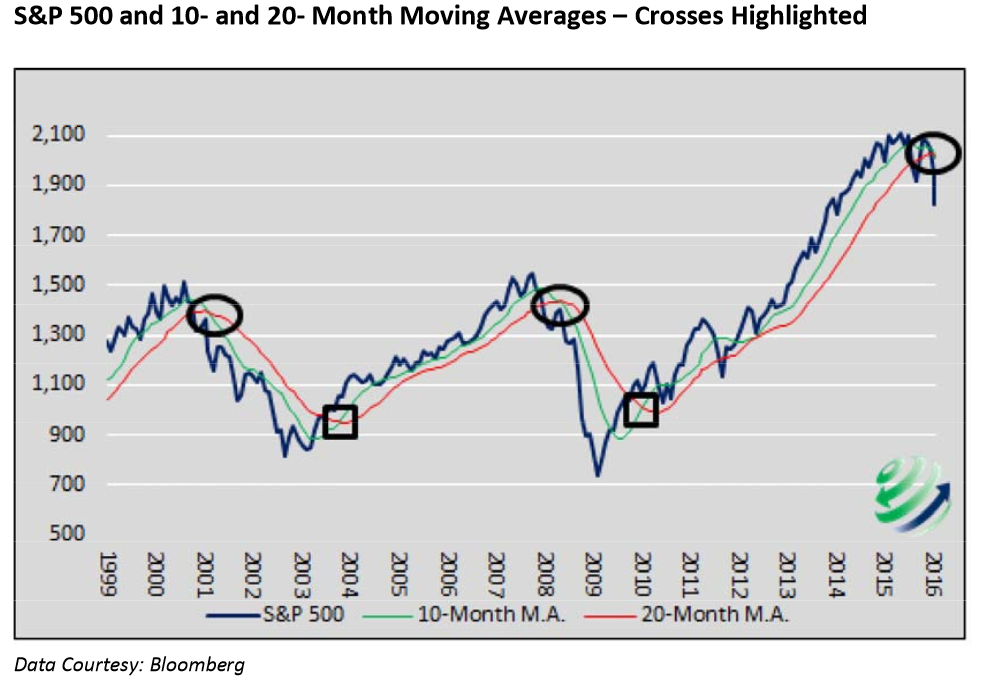
The chart below shows the monthly price of the S&P 500 since 1999 in blue. It is flanked by the 10 and 20 month moving averages in green and red respectively. Note that when the 10-month moving average rises above the 20-month moving average, it has signaled the early stages of a sustained rally in the S&P 500. Conversely, when the 10-month moving average falls below the 20-month moving average it has signaled a prolonged decline.”
“In the following graph, we drew circles around the 3 instances that the 10-month moving average crossed below the 20-month moving average and ‘positive momentum stalled.’ Alternatively, boxes are used to show when the opposite happened and ‘negative momentum stalled.’”
“The graph below enlarges the past year to show that as of late February 2016 the 10-month moving average dipped below the 20-month moving average –a potential indication of ‘stalled positive momentum’”
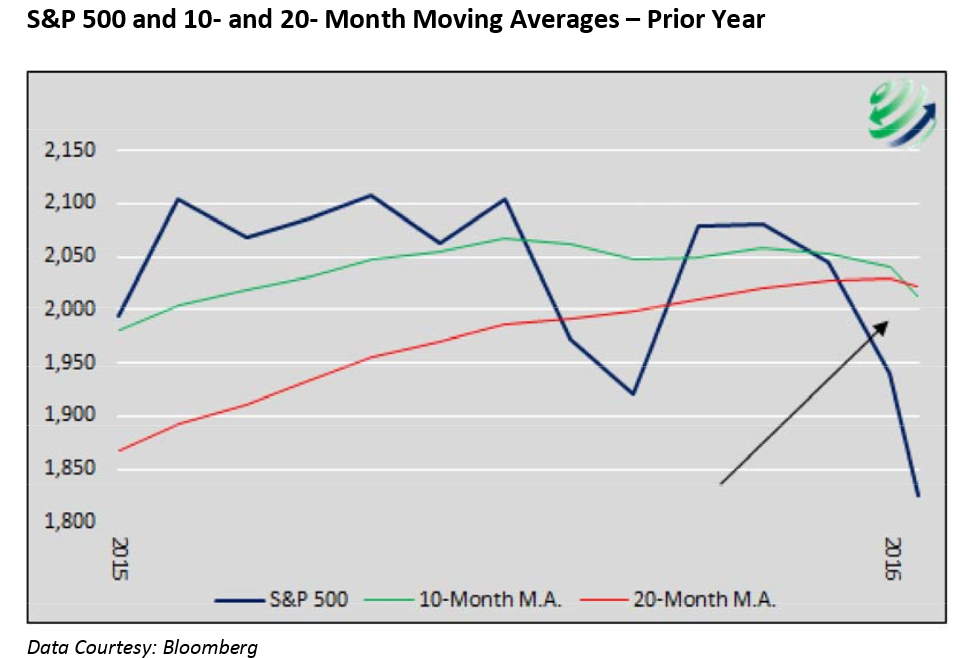
Important Disclosure: The moving averages shown above are based on the value of the index in late February 2016. The crossing of the two moving averages will not be “official” until the end of the month. By our calculations, a closing price of 1993 or lower on the S&P 500 on February 29th would cause the 10-month moving average to drop below the 20-month moving average.
“Summary: Some investors are pure technicians and only use technical analysis to allocate capital. Others disregard it entirely; swearing it off as voodoo. As chart patterns are merely a reflection of capital flows resulting from human decision making, we believe technical analysis offers useful insight and can be helpful in gaining further conviction around an investment idea.
If, by the end of February, there is indeed a crossover of the moving averages, we will have a higher level of confidence that the near constant march higher in prices since 2009 has reversed its trend. If history proves prophetic, buckle up. Stock prices may be in for a precipitous decline.”
Any of that sound familiar. It should. It is the same message I have discussed with you since the beginning of the year. It also goes to the heart of why “buy and hold” investing is indeed a fallacy wrapped in a lie.
DON’T BUY THE “BUY & HOLD” LINE OF B.S.
I recently penned an entire article on the fallacy of buy and hold investing. However, my friend Jesse Felder via the Felder Report did a super job of reiterating the point this week.
“Far more money has been lost by investors preparing for corrections, or trying to anticipate corrections, than has been lost in corrections themselves.” – Peter Lynch
“This quote has been making the rounds since the market’s 2% decline last Thursday. It’s a great quote; I’m a huge Peter Lynch fan. I’ve read each of his books at least twice and recommend them enthusiastically.
However, I think there’s an important point to be made here. Peter Lynch managed money professionally from 1977 to 1990 putting up an amazing track record: 29% average annual returns. No doubt this places him in a very elite class of the most skilled investors ever. But he also had a massive tailwind to work with as the stock market was very attractively valued during his entire career.
Below is a chart of the total stock market value relative to GDP (via Doug Short). I’ve circled the area that represents Lynch’s career in red:”
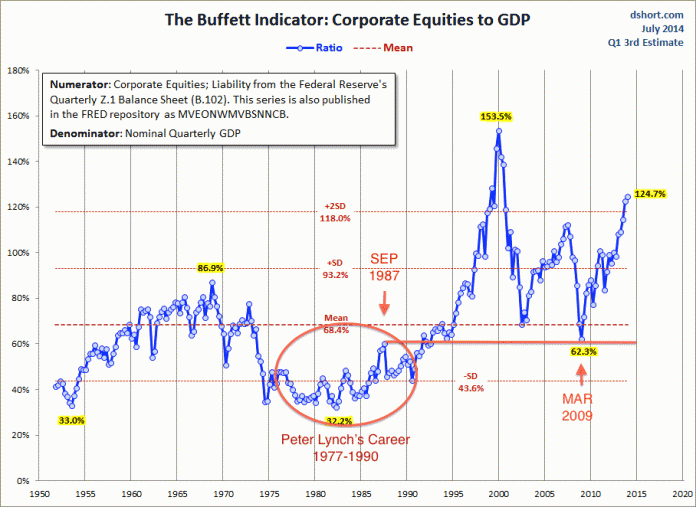
“Over the past couple of decades there was maybe only a single month, at the very bottom of the financial crisis, during which stock market valuations neared the levels that Peter Lynch had to work with. And even then those levels, of about 60% market cap to GDP – that we considered cheap, during his career represented the month just before the 1987 crash!
Considering what investors have gone through since Lynch retired, the aftermath of the internet bubble, housing bubble and financial crisis, I think it would be very difficult to make the case that they lost far more money over the past couple of decades trying to sidestep these debacles than the money lost by those who didn’t sidestep them.“
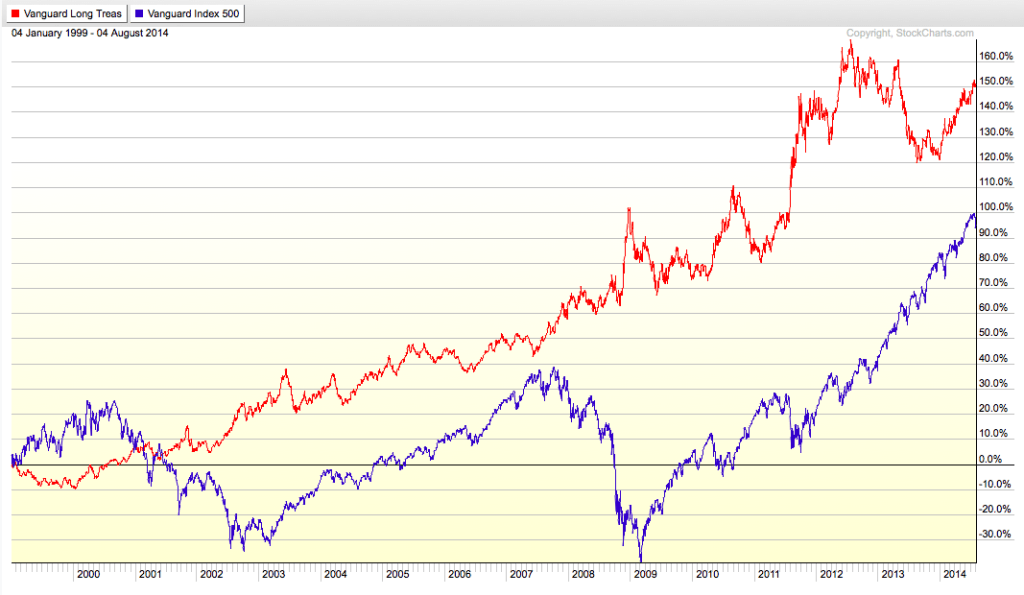
“When Treasury Bonds far outperform stocks over a 15 year period, I’d say sidestepping the madness of these markets has paid off fairly well. And considering the fact that stocks are now, once again overvalued to the point that an investor can expect roughly a 0% return over the coming decade, I’d say it will probably pay to sidestep it once again.”
Jesse has this absolutely right. The essence of “buy and hold investing” has been corrupted by Wall Street in the endeavor to turn a traditionally commissioned based business into an “annuity stream.” This is great for Wall Street, but bad for you.
The truth of “buy and hold” investing was best summed up in the following quote:
“Buy when everyone else is selling and hold until everyone else is buying. This is more than just a catch slogan. It is the very essence of successful investing.” – J Paul Getty
Something to think about the next time someone tells you to just “hold for the long term.”
THE MONDAY MORNING CALL
All week investors have been hoping that the G-20 meeting would yield more Central Bank commitments for further monetary interventions to keep the “circus in town.” Unfortunately, Monday morning may see the markets under pressure as such hopes were left “wanting.”
Here is the key passage from Bloomberg:
“The G-20 members agreed to use monetary, fiscal and structural tools to boost growth, according to a final communique released in Shanghai on Saturday. Underscoring concerns over the limitations of central bank-led stimulus, ‘monetary policy alone cannot lead to balanced growth,‘ the document said.
Leading into the meetings, Bank of England Governor Mark Carney warned counterparts against getting embroiled in a currency war by pushing interest rates too low, while International Monetary Fund Managing Director Christine Lagarde said the effects of monetary policies, even innovative ones, are diminishing.
With the U.K. mulling spending cuts, Japan planning a sales tax increase, Germany’s finance minister warning debt-funded growth just leads to ‘zombifying’ economies, and the U.S. constrained by a lame duck president and Republican-controlled Congress, it may fall to China to ratchet up the fiscal firepower.
‘Investor hopes of coordinated policy actions proved to be pure fantasy,’ said David Loevinger, a former China specialist at the U.S. Treasury and now an analyst at fund manager TCW Group Inc. in Los Angeles. ‘It’s every country for themselves.’”
This is not likely to set well with investors as markets continue to deteriorate internally as shown in the market internal study below. (This is a monthly study, so only end-of-the-month closes are counted.)
While the market is desperately clinging onto long-term moving average support currently, it is only barely doing so. What is clearly apparent is that despite “bullish hopes” that the recent correction has now ended, with all internal measures pointed lower this will likely prove not to be the case.
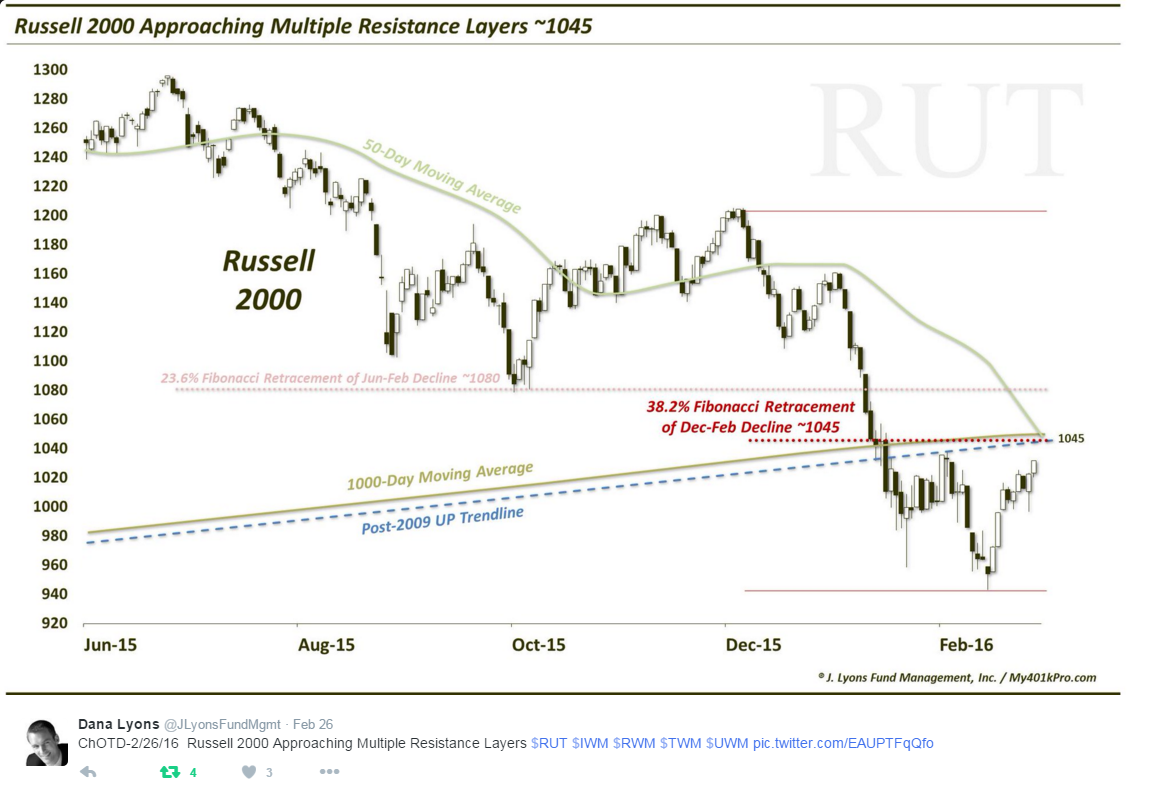
Dana Lyons noted on Saturday that the Russell 2000, which has been under considerably more downward pressure in recent months, is approaching multiple layers of overhead resistance. A failure at those resistance levels will continue to confirm the bearish trend in the Russell 2000 which is already in a full-fledged bear market.
WAITING FOR CHANGE
As stated two weeks ago in this weekly missive:
“I recommended using any rally this week to move to the lowest level of equity exposure for this part of the cycle. (When the bear market is confirmed we will take portfolios to market neutral by hedging off any remaining equity risk, but we are not there as of yet.)
I suggest doing this by:
- Trimming back winning positions to original portfolio weights: Investment Rule: Let Winners Run
- Selling positions that simply are not working (if the position was not working in a rising market, it likely won’t in a declining market.) Investment Rule: Cut Losers Short
- Holding the cash raised from these activities until the next buying opportunity occurs. Investment Rule: Buy Low
As such there is now little for us to do except to wait, and watch patiently, for the market to either confirm a “bear market,” OR stabilize and begin to rebuild the bullish supports necessary to allow equity risk to once again be increased.
Neither situation will make itself apparent in short order, so relax and we let the market dictate what actions we take next. “Guessing” at the markets has not typically been a successful and repeatable strategy.”
So, for now, we continue to wait. When indicators begin to improve, and turn back into the positive, which could be next week, month, or year, such will be the indication “more constructive market dynamics” are in place increasing the reward/risk ratio. That is not now.
As investors, we should not be basing our investment decisions on “hope,” but rather an analysis of the evidence that would put the highest probability of “winning” in our favor. While you can certainly continue betting on “weak hands,” any good poker player will tell you that is a sure way to eventually go broke.

