
Companies Lose Billions On Stock Buybacks
I recently wrote an article about why “Benchmarking Your Portfolio Is A Losing Bet.” In that missive, I discussed all the things that benefit a mathematically calculated index versus what happens in an actual portfolio of securities. One of those issues was the impact of share buybacks:
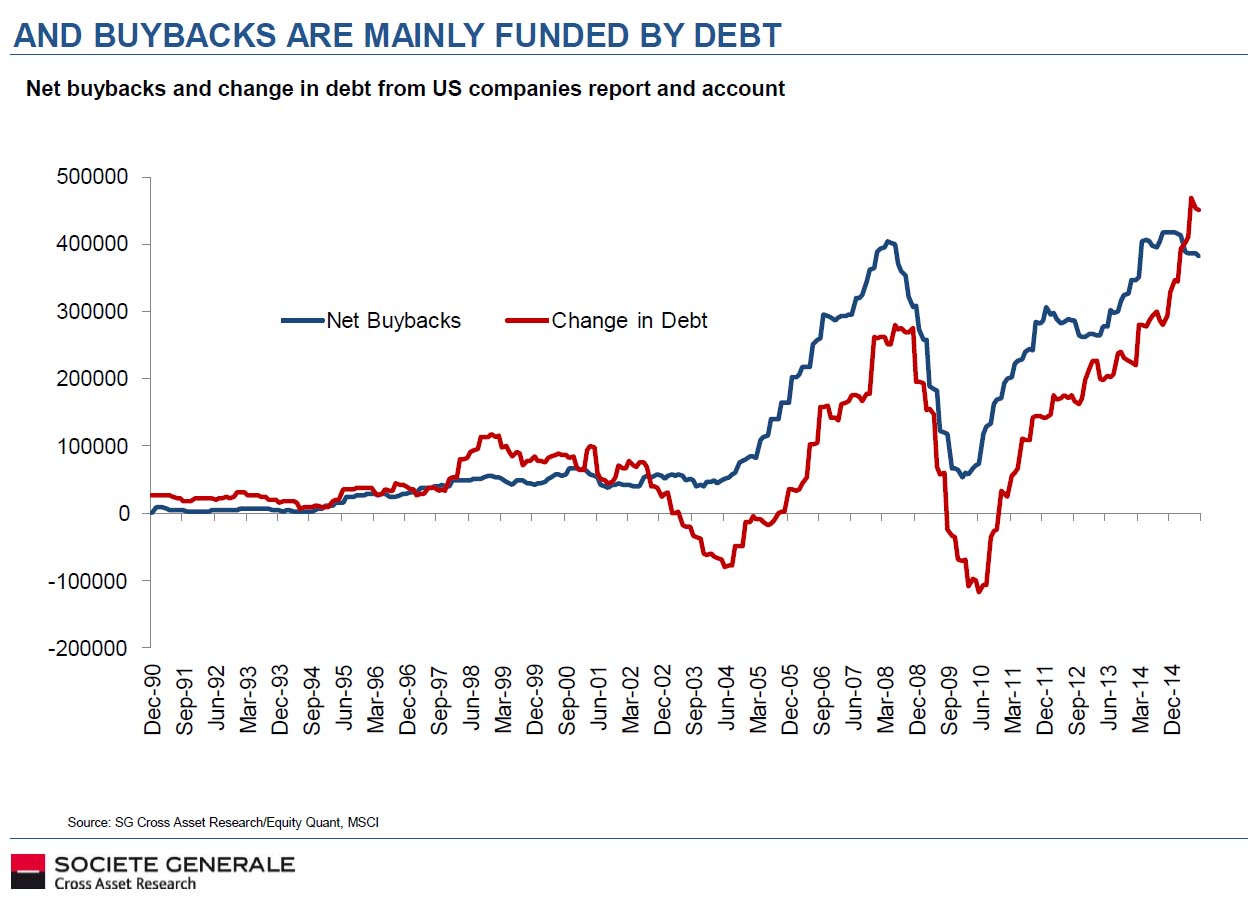
“The reality is that stock buybacks are a tool used to artificially inflate bottom line earnings per share which, ultimately, drives share prices higher. As John Hussman recently noted:
The preferred object of debt-financed speculation, this time around, is the equity market. The recent level of stock margin debt is equivalent to 25% of all commercial and industrial loans in the U.S. banking system. Meanwhile, hundreds of billions more in low-quality covenant-lite debt have been issued in recent years.”
Note the surge in debt to fund those buybacks.
“The importance of buybacks cannot be overlooked. The dollar amount of sales, or top-line revenue, is extremely difficult to fudge or manipulate. However, bottom line earnings are regularly manipulated by accounting gimmickry, cost cutting, and share buybacks to enhance results in order to boost share prices and meet expectations. Stock buybacks DO NOT show faith in the company by the executives but rather a LACK of better ideas for which to use capital for.”
The entire article is worth a read to understand how indices and your portfolio are two very different things.
I bring this up because surges in stock buybacks are late bull market stage events. This is something I have repeatedly warned about in the past it is a false premise that companies repurchase stock at high prices because they have faith in their company. Such actions eventually lead to rather negative outcomes as capital is misallocated to non-productive resources.
Bernard Condon via AP picked up on this issue:
“When a company shells out money to buy its own shares, Wall Street usually cheers. The move makes the company’s profit per share look better, and many think buybacks have played a key role pushing stocks higher in the seven-year bull market.
But buybacks can also sap companies of cash that they could be using to grow for the future, no matter if the price of those shares rises or falls.
Defenders of buybacks say they are a smart use of cash when there are few other uses for it in a shaky global economy that makes it risky to expand. Unlike dividends, they don’t leave shareholders with a tax bill. Critics say they divert funds from research and development, training and hiring, and doing the kinds of things that grow the businesses in the long term.
Companies often buy at the wrong time, experts say, because it’s only after several years into an economic recovery that they have enough cash to feel comfortable spending big on buybacks. That is also when companies have made all the obvious moves to improve their business — slashing costs, using technology to become more efficient, expanding abroad — and are not sure what to do next to keep their stocks rising.
‘For the average company, it gets harder to increase earnings per share,’ says Fortuna’s Milano. ‘It leads them to do buybacks precisely when they should not be doing it.’
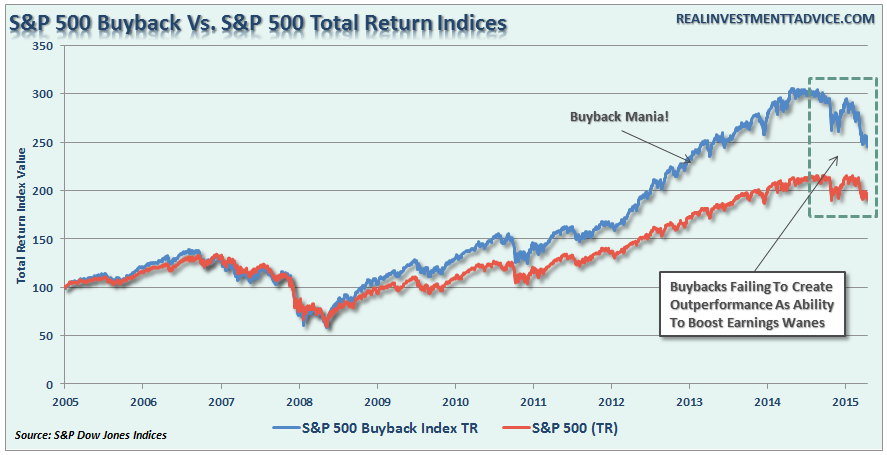
And, sure enough, buybacks approached record levels recently even as earnings for the S&P 500 dropped and stocks got more expensive. Companies spent $559 billion on their own shares in the 12 months through September, according to the latest report from S&P Dow Jones Indices, just below the peak in 2007 — the year before stocks began their deepest plunge since the Great Depression.”
While buybacks work great during bull market advances, as individuals willfully overlook the fundamentals in hopes of further price gains, the eventual collision of reality with fantasy has been a nasty event. This is shown in the chart below of the S&P 500 Buyback Index versus the S&P 500 Total Return.
If this was the Dr. Phil Show, I am sure he would ask these companies;
“Well, how is that working out for you ?”
Tax Withholding Paints Real Employment Picture
I always find the mainstream media and blogosphere quite humorous around employment reporting day. The arm waving and cheering, as the employment report is released, reaches the point of hilarity over some of the possibly most skewed and manipulated economic data released by any government agency.
Think about it this way. How can you have the greatest level of employment growth since the 1990’s and the lowest labor force participation rate since the 1970’s? Or, how can you have 4.9% unemployment but not wage growth? Or, 95.1% of the population employed but 1/3rd of employable Americans no longer counted?
The importance of employment, of course, is that individuals must produce first in order to consume. Since the economy is nearly 70% based on consumption, people need to be working to create economic growth. Of course, there is another problem with the data. How can you have 4.9% unemployment and an economic growth rate of sub-2%?
A recession is coming and a look at real employment data, the kind you can’t fudge, tells us so. David Stockman recently dug into the data.
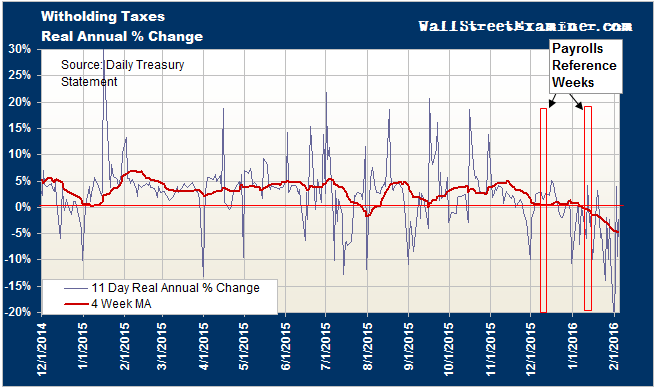
“If we need aggregated data on employment trends, the US government itself already publishes a far more timely and representative measure of Americans at work. It’s called the treasury’s daily tax withholding report, and it has this central virtue: No employer sends Uncle Sam cash for model imputed employees, as does the BLS in its trend cycle projections and birth/death model; nor do real businesses forward withholding taxes in behalf of the guesstimated number of seasonally adjusted payroll records for phantom employees who did not actually report for work.
My colleague Lee Adler…now reports that tax collections are swooning just as they always do when the US economy enters a recession.
The annual rate of change in withholding taxes has shifted from positive to negative. It has grown increasingly negative in inflation adjusted terms for more than a month and it is the most negative growth rate since the recession.”
“Needless to say, the starting point for overcoming the casino’s blind spot with respect to the oncoming recession is to recognize that payroll jobs as reported by the BLS are a severely lagging indicator. Here is what happened to the headline jobs count in just the 12 months after May 2008. The resulting 4.6% plunge would amount to a nearly a 7 million job loss from current levels.”
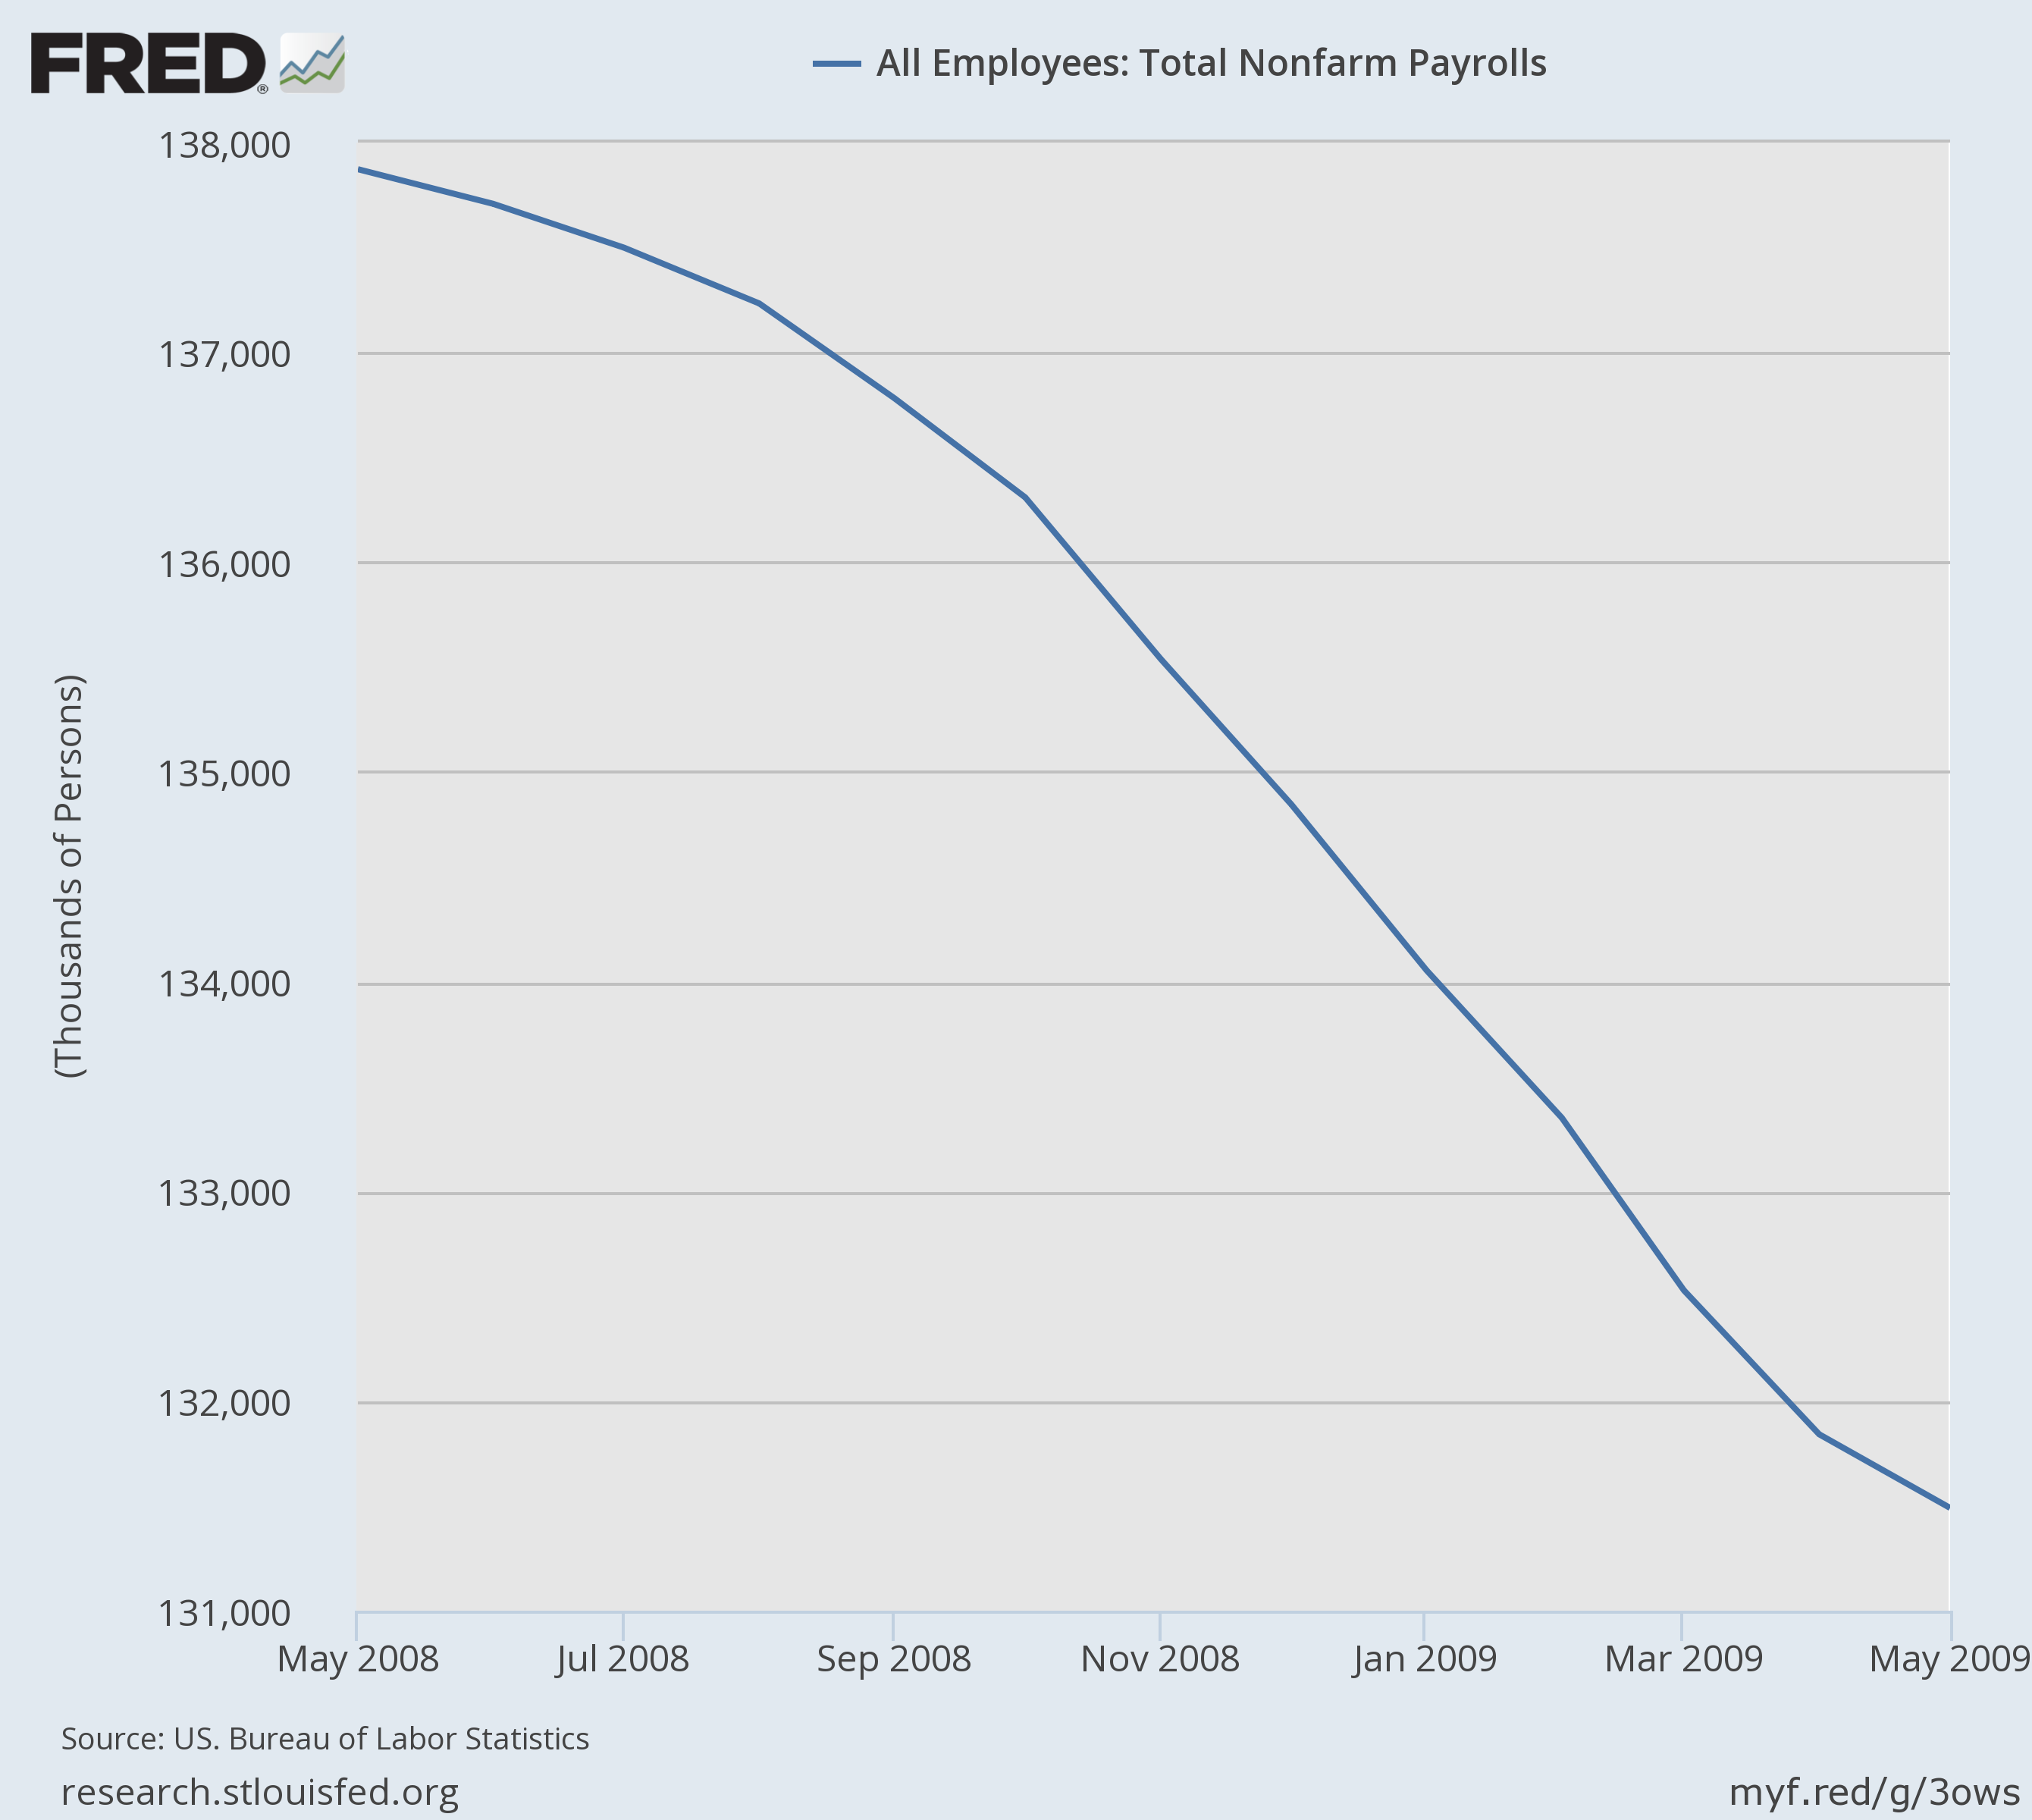
Good point.
Is The Yield Curve Indicator Broken?
As one indicator after another is signaling that the U.S. economy is on the brink of a recession (see here and here), the bulls are desperately clinging to the yield curve as “proof” the economy is still growing.
There are a couple of points that need to be addressed based on the chart below.
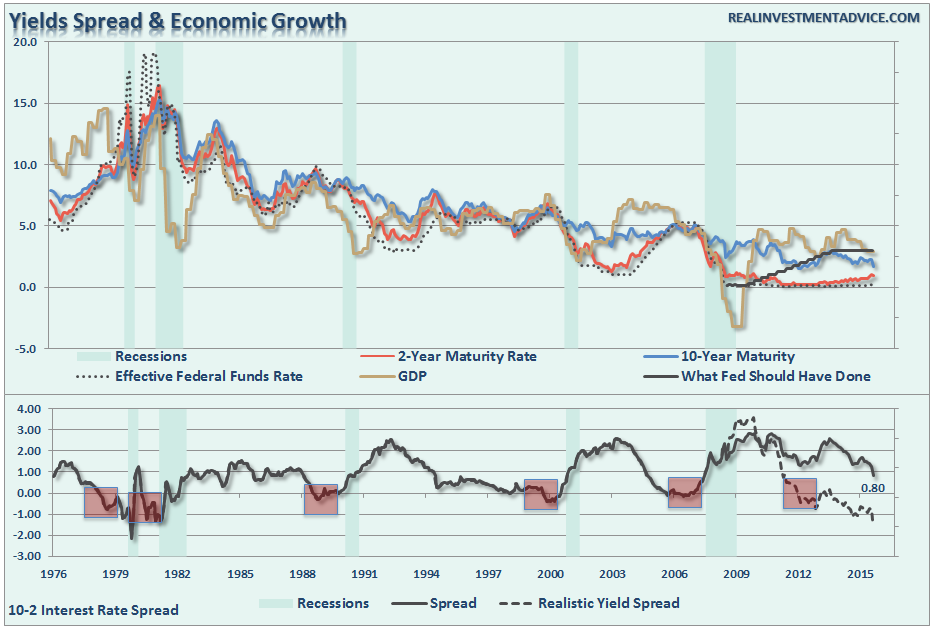
- As shown in the chart above, the 2-year Treasury has a very close relationship with the Effective Fed Funds Rate. Historically, the Federal Reserve began to lift rates shortly after economic growth turned higher. Post-2000 the Fed lagged in raising rates which led to the real estate bubble / financial crisis. Since 2009, the Fed has held rates at the lowest level in history artificially suppressing the short-end of the curve.
- The artificial suppression of shorter-term rates is likely skewing the effectiveness of the yield curve as a recession indicator.
- Lastly, negative yield spreads have historically occurred well before the onset of a recession. Despite their early warnings, market participants, Wall Street, and even the Fed came up with excuses each time to why “it was different.”
Just as the yield spread was negative in 2006, and was warning of the onset of a recession, Bernanke and Wall Street all proclaimed that it was a “Goldilocks Economy.” It wasn’t.
Here is the point, as shown in the chart above, the Fed should have started lifting rates as the spike in economic growth occurred in 2010-2011. If they had, interest rates on the short-end of would have risen giving the Fed a policy tool to combat economic weakness with in the future. However, assuming a historically normal response to economic recoveries, the yield curve would have been negative some time ago predicting the onset of a recession in the economy about…now. Of course, such would simply be a confirmation of a majority of other economic indicators that are already suggesting the same.
Just some things to think about.
Lance Roberts

Lance Roberts is a Chief Portfolio Strategist/Economist for Clarity Financial. He is also the host of “The Lance Roberts Show” and Chief Editor of the “Real Investment Advice” website and author of “Real Investment Daily” blog and “Real Investment Report“. Follow Lance on Facebook, Twitter, and Linked-In

