
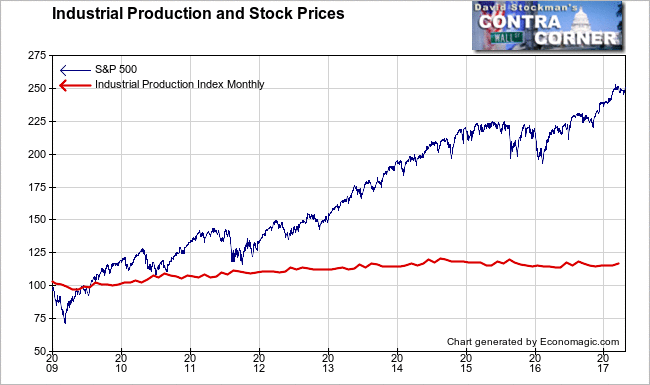
On Monday, the Fed reported Industrial Production that was… meh. Meanwhile the stock market has been soaring.
If stock prices had anything to do with economic fundamentals, wouldn’t there be some correlation with US industrial production? The Fed’s Industrial Production (IP) index either includes or represents the entire US economy. It directly includes the unit output of US manufacturers, mines and oil and gas production, and electric and gas utilities. It also represents everything else indirectly. After all, households and service businesses use the output of those manufacturers, mines, oil and gas producers, and utilities. If households and service businesses are thriving and growing, they use more of what industry produces. If those businesses and households use less, then that means that they aren’t doing well.
It is true that there’s been a bump in IP in the past 12 months, and it is true that there has been some recovery in IP since the bottom of the recession in 2009. But that recovery stalled in 2014. Since then the US economy hasn’t been doing well at all by this measure. They have gone flat. Meanwhile, we all know what stock prices have done.
Electric and Gas Utilities production are a particularly interesting measure because utilities serve everybody and everything. They measure how much energy we’re using in our shopping centers, our office buildings, our warehouses, and our homes, as well as in our factories. If the US economy is growing, utilities should be producing more. And if they’re not producing more, that means that we’re using less. In other words, the economy is weak. Unfortunately, the latter is what the data is showing.
There are 3 lines on this chart of utilities production. All 3 show strong trend growth from 1990 to 2008. But then the growth stopped.
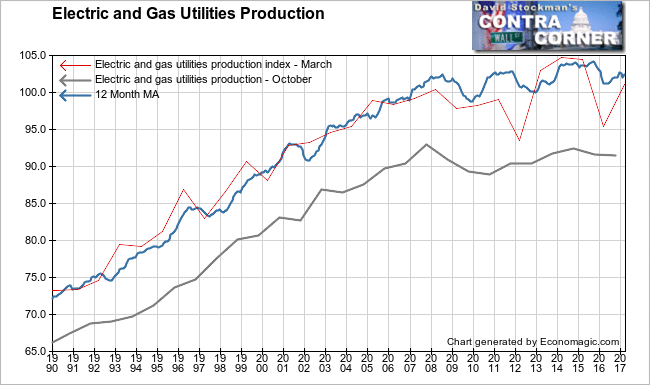
The thin red line is the March level of utilities production back to 1990. It is wildly volatile because March is the transition month from winter to spring. When the weather in the Northeast and Midwest in particular is colder than normal, utilities are called on to produce more. When it’s warmer than usual in those areas, they produce less. Hence the big year to year fluctuation. Even with that fluctuation, current production is still about 3% below the peak level of 2014. And it is barely 1% above the level reached in 2008, when trend growth first came to a standstill.
The blue line is the 12 month moving average of utilities production. Because it’s the annual average, there’s no seasonal variation. The cycles you see there are just that–business cycles, however subtle. Even if the US economy doesn’t go into recession, its growth rate fluctuates. When the economy isn’t trending, the cycle is more apparent. The economy hasn’t been trending for nearly 10 years.
The US economy essentially stopped growing in 2008 by this measure. It had infinitesimal growth from 2008 to 2014. The total growth in utilities production over that span was actually less than US population growth. Annual average production today is about 1.5% lower than in 2014. It is unchanged from 2008.
The gray line is the October production level. Weather changes do not play a material role in October. Temperatures are usually temperate enough that extra production for heating or air conditioning is rarely required. Here you can see an economy that topped out in 2007. It has been dead ever since. 2016 October production was about 1% below the 2007 peak in spite of population that is 8% greater than in 2007. Increased energy efficiency has played a role, but negative growth of 1% vs. population growth of 8% obviously suggests a problem.
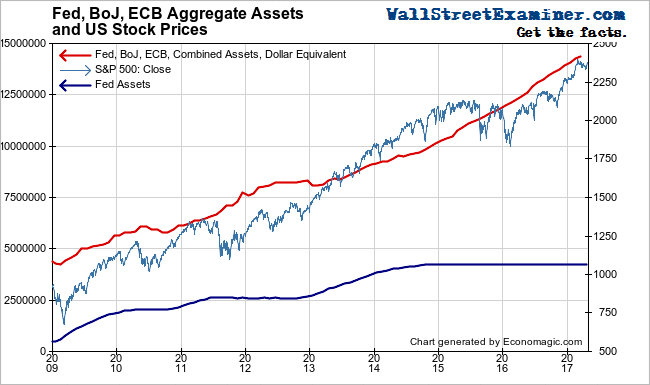
The lack of economic growth hasn’t mattered one iota to the stock market. Economic fundamentals simply don’t matter any more. Central banks changed the rules of the game in 2009. Since then, only money printing (aka QE) has mattered to stock prices. And it’s not just the Fed. When the Fed stopped printing in late 2014, the BoJ and ECB printed more. Some of that regularly flows into US markets, boosting US stock and bond prices.
Money printing drives asset inflation. Unfortunately, contrary to what Ben Bernanke and the Trickledownists had promised us, there has been no trickle down. Most new jobs have been in low income service occupations like retail, and lately even those have been disappearing. That leaves a few new high paying jobs requiring special skills and expertise, but mostly minimum wage jobs like aides to the elderly, fast food workers, and hospital orderlies. Honest service work, but no one will ever be able to contribute to economic growth with jobs like that.
The Industrial Production chart shows that total IP rose by about 20% between 2009 and 2014. The S&P 500 rose by roughly 120% over that span. Then in 2014, Industrial Production stalled. Total IP is below the 2014 peak. But the S&P 500 has risen by another 14% since then.
Does that make sense? Maybe it would if corporate profits had risen. But they are down 5% since 2014.
source: tradingeconomics.com
If profits haven’t risen, that can only mean that Price/Earnings ratios have risen. That’s the price of $1 of corporate earnings per share. It is the purest measure of asset inflation. I look at it as a long term measure of investor sentiment. The higher the PE ratio, the more bubbly is investor sentiment. By that standard, the current market is certainly bubbly.
But bubbly markets can and do get bubblier. They end when Central Banks think that the markets are overheated and there’s enough CPI inflation. The Fed has already made that decision, and is not only pretending that it is raising the Faux Funds rate, it is making noises about shrinking its balance sheet. That’s seriously bearish stuff.
But perhaps more importantly, we are hearing noises out of Europe and Japan about how their central banks will exit QE. Central bank talk ultimately leads to action. It’s early yet, but the endgame has begun. Play it carefully, with stops just below technical trendlines on your stock holdings.
Follow Lee’s weekly market timing reports, including ETF trading recommendations, in the Wall Street Examiner Pro Trader Market Updates. Currently open picks have an average gain of 9.2% and an average holding period of 39 days. Try the service risk free for 90 days.

