
I have two sets of interesting charts from reader Tim Wallace on labor force, population, and employment.
This post shows the first set, a comparison of April 2008 to April 2104. Click on any chart to see a sharper image.
Age 16-24 Stats
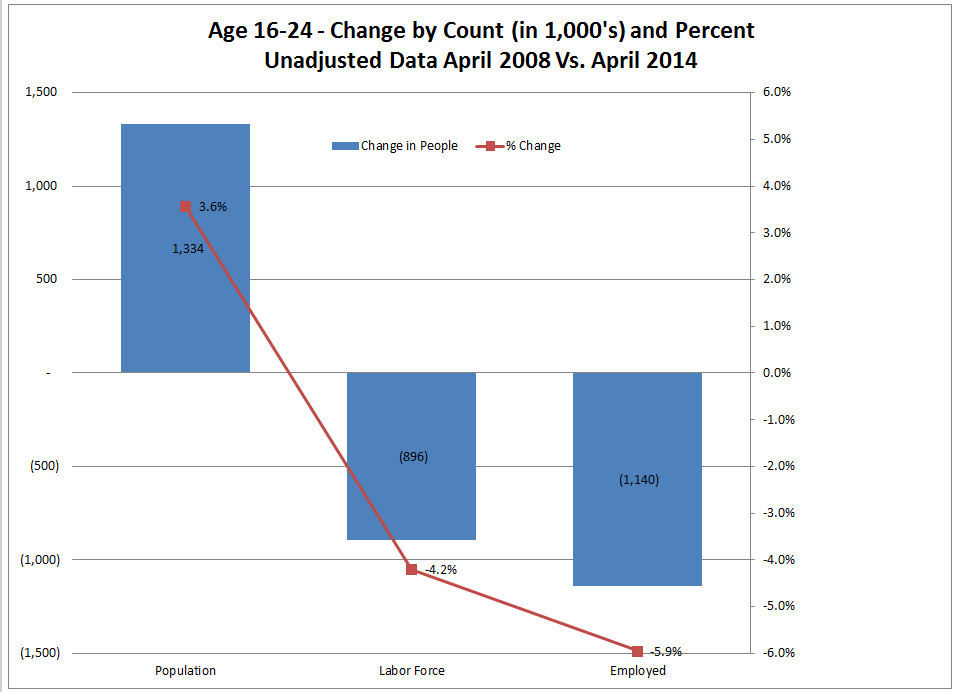
Since April 2008, the population in age group 16-24 rose by 3.6% but the labor force declined by 4.2%, and employment fell by 5.9%.
Age 25-54 Stats

Since April 2008, the population in age group 25-54 declined 0.8%, but the labor force declined 3.6%, and employment declined 4.6%.
Age 55-64 Stats
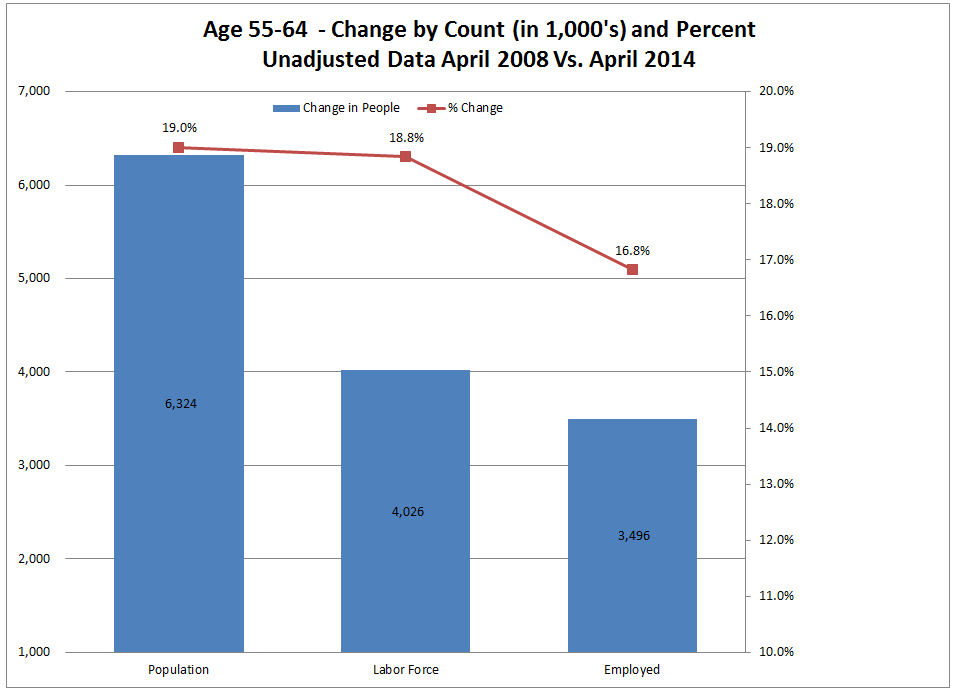
There are significant surges in Population, Labor Force and Employed in the 55-64 age group. Most employment growth is here. However, employment did not come close to keeping up with growth in population.
Age 65+ Stats

Although the Population growth is high, the rate of growth for employment and for those in the labor force is much higher. More older people are staying working than retiring as in the past.
Synopsis
The above charts post a rather dim view of the recovery since the start of the recession.
In the core age 25-54 age group, the population is down 1,053,000 but employment is down a whopping 4,614,000.
Thus, in the 25-54 age group, roughly 3,561,000 people are not working who should be working. The figure is higher if you include other age groups.
Clearly things are not close to normal.
In a subsequent post we will take a look at the last two years (April 2012 vs. April 2014).
Mike “Mish” Shedlock
http://globaleconomicanalysis.blogspot.com

