
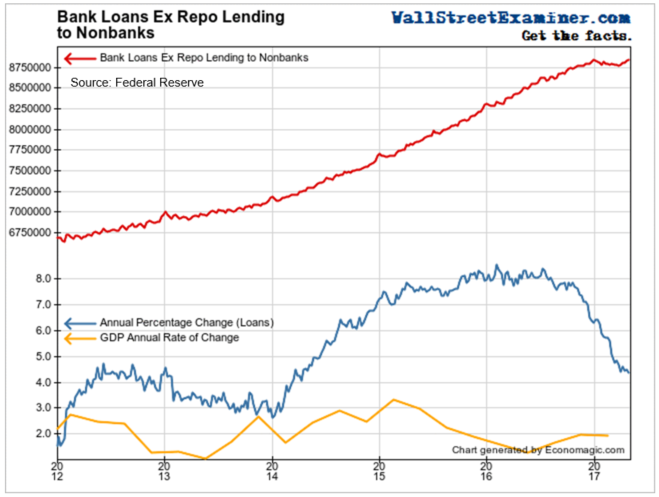
Total bank lending bounced back a bit in April, but that was still in the context of steadily slowing growth over the past year.
This slowing in credit growth has created a yawning divergence from the direction of stock prices, which continue to forge new highs while loan growth stagnates. That’s a warning sign that it’s getting late for the bubble driven by free and easy credit. The wave of speculation driven by that credit is ebbing. Now let’s look at some of the components of that credit.
We saw the plunging growth in combined consumer and commercial and industrial loans in this chart. The rapidly slowing demand for combined commercial and consumer loans indicates a slowing economy.
But that hasn’t stopped banks from becoming more complacent, even reckless, about the future.
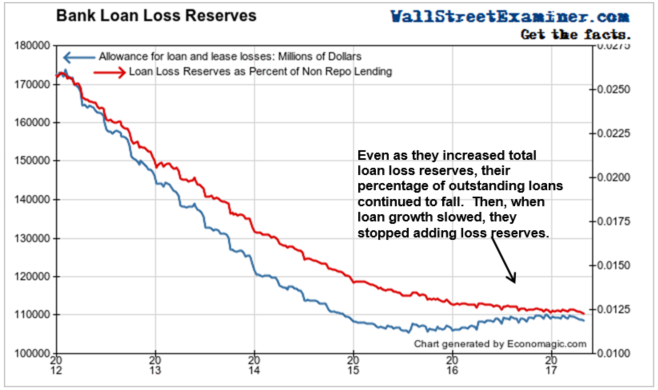
Bank Loan Loss Reserves
Banks’ loan loss reserves reached another post crisis record low as a percentage of loans outstanding in April. Not only did they decline as a percentage of total loans, the banks even cut total loss reserves. That took them to a new low. This is just another symptom of the steadily increasing systemic risk inherent in bubble behavior. Imprudent behavior is a product of confidence growing to the point of irrationality.
As loans outstanding soared and GDP growth slowed, you would think that bankers might recognize the increasing risk and set aside a bit more in reserves. But they haven’t seen it that way. They cut loss reserves from $170 billion to $106 billion between 2012 and mid 2015. They rebuilt reserves slightly as their lending skyrocketed in 2017. As a result, their loan loss reserves fell to 1.25% of non-repo loans outstanding. That’s hardly a safety cushion. Now this year they have again begun reducing reserves outright and they are now back below 1.25% of outstanding loans.
What happens when the Fed tightens, the economy weakens, and loan losses soar? Bankers are counting on a growing economy to keep the loans they have issued for the past few years from going sour. A growing bubble can hide a multitude of sins. Once that growth stops, those sins are uncovered in the form of non performing loans that can wreak havoc.
Commercial and Industrial Lending Has Collapsed
Banks have essentially stopped making C&I loans. It’s not because of tightened credit conditions. Demand has collapsed. The annual growth rate is collapsing, now down to just 2.4% from 6% in January. The growth rate was more than 13% in early 2015. Total outstanding C&I loans have hardly grown at all since October 2016. Essentially there’s been zero growth in the last 3 quarters.
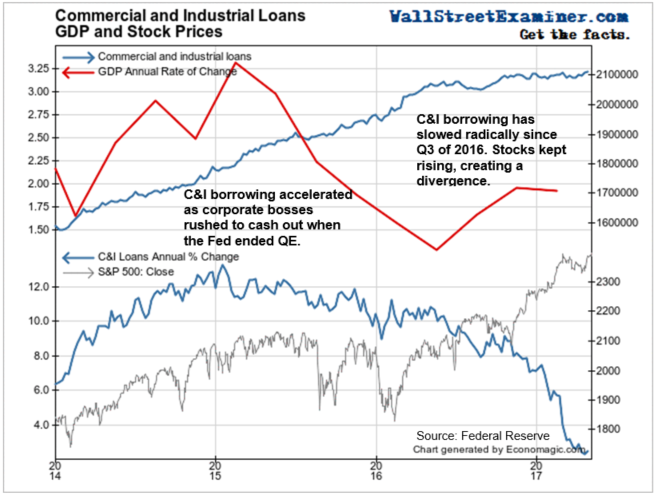
Much of the previous growth in C&I loans was from corporations doing financial engineering type loans largely to buy back their company’s stock. But the last surge in stock prices didn’t have that support. It’s one less prop for the bubble.
Real Investment in Plant and Equipment
Real Business Investment rose by 2.5% year over year in March. That’s not too shabby, but business people make their decisions on whether to build and invest in their business largely based on the stock market. The level of business investment tends to trail stock price movements by 3 to 4 quarters. That’s about how long it takes the decision making process to result in spending. The current year to year increase is a reflection of last year’s stock market. In other words, this is not a leading indicator.
What’s important here is the big picture divergence between stock prices and real business investment. This huge divergence shows that all of the growth in commercial and industrial lending went to something other than real investment. It went into boosting stock prices. Corporate CEOs and CFOs have gotten much less aggressive on that front lately, so they’re funneling a bit more into real investment. But demand isn’t showing up in final sales data. This is just more evidence of speculative behavior not supported by fundamentals.
So real business investment may not be leading the market, but it certainly tells us a great deal about the character of both real investment and financial speculation. In this case, it’s a clear warning that this is still not rational decision making at work. It’s based on hope and rank speculation.
The recent gain still hasn’t broken the long term trend of declining real investment. Given the elapsed time since this expansion began in 2010, we’re likely to be much closer to its end than somewhere in the middle. Real growth has only totaled 2.3% since 2014. That was with rates at zero most of the time. What happens if rates begin to rise in earnest. We’ll find out when the Fed starts withdrawing cash from the system in earnest later this year. It won’t be pretty.
The sources of liquidity driving the stock market rally are gradually falling by the wayside. The Fed is on the sidelines, and will become outright hostile when it starts shrinking its assets. That will withdraw cash from the system. Now stock buyback deals suddenly look a lot less interesting to businesses as well. They have stopped borrowing and instead of doing stock buybacks, they are funneling money into fixed investment. Sounds good in theory, but the demand for it is not there. It’s just more wild speculative behavior, not to mention that investment in robots doesn’t create final consumer demand.
There is still cash flowing into the markets from Europe and Japan as the ECB and BoJ continue printing, but now the ECB is making loud noises about normalization and the BoJ is floating trial balloons as well. As the Fed’s cohorts begin to turn these thought trends into action, the slowing cash flows will show up in US banking indicators in the Fed’s weekly H8. I’ll be tracking those trends for you.
This report is derived from Lee Adler’s Wall Street Examiner Pro Trader Monthly Macro Liquidity Reports.
Lee first reported in 2002 that Fed actions were driving US stock prices. The US Treasury has also played a role in directly moving markets. Lee has tracked and reported on those relationships for his subscribers for the last 15 years, helping to identify major turning points in the markets in their earliest stages. Try Lee’s groundbreaking reports on the Fed and the Monetary forces that drive market trends for 3 months risk free, with a full money back guarantee. Be in the know.

