The headline, fictional, seasonally adjusted (SA) number of initial unemployment claims for last week came in at 278,000. The Wall Street conomist consensus guess was 290,000.
Rather than playing the expectations game, our interest is in the actual, unmanipulated data. Analyzing that is the only way to be sure that you are seeing what’s really going on.
The Department of Labor reports the actual unadjusted data clearly and illustrates it in comparison with the previous year. The DoL also reports exactly how messy the seasonally adjusted data is by reporting what the seasonal adjustment had forecast based on the arbitrary mathematical calculation of what’s normal. The mainstream financial media crowd chooses to ignore reality by not reporting the actual number.
According to the Department of Labor the actual, unmanipulated numbers were as follows. “The advance number of actual initial claims under state programs, unadjusted, totaled 305,712 in the week ending January 31, an increase of 23,827 (or 8.5 percent) from the previous week. The seasonal factors had expected an increase of 11,211 (or 4.0 percent) from the previous week. There were 357,742 initial claims in the comparable week in 2014. ”

This year’s performance was a little worse than average for that week of January, but the difference wasn’t material. The actual week to week change was an increase of 24,000 (rounded). The 10 year average for that week is an increase of 9,000 (rounded). This year’s increase compared with a virtually unchanged week in the comparable week of 2014, and an increase of 19,000 in that week of 2013.
Actual first time claims were 14.5% lower than the same week a year ago. This is within the normal range of the annual rate of change. Since 2010 the change rate has mostly fluctuated between -5% and -15%. There is no sign of weakening yet.
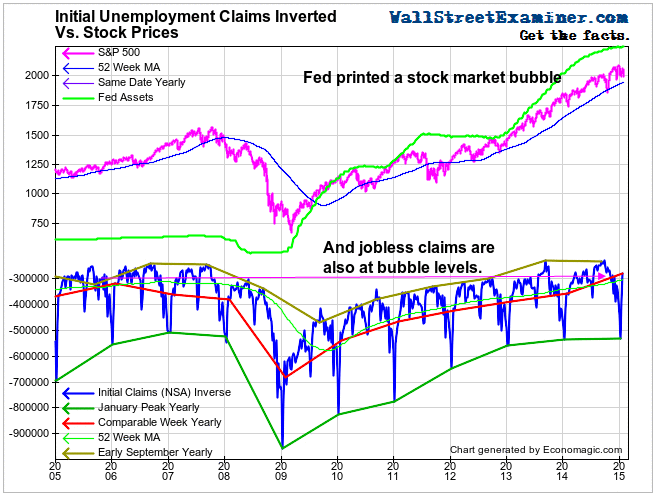
In bubble like behavior, employers are hoarding workers. Businesses have been unusually reluctant to cut employees. In fact, initial claims are all time record lows in terms of the number of claims per million workers. Is that a sign of a healthy, growing economy, or a bubble economy stretched to the limit? The last two times these numbers were nearly as strong were at the tops of the housing bubble and the internet/tech bubble. The current readings come on the heels of the long running US oil/gas bubble, which has recently collapsed. So far the numbers from the oil producing states suggest no increase in oil worker layoffs yet. That’s still to come.
I track the daily real time Federal Withholding Tax data in the Wall Street Examiner Professional Edition. It too has been very strong over the past couple of weeks. The growth rate of withholding taxes is now running at an annual rate of gain of about 5% in real terms, adjusted for the trend rate of increase in workers’ weekly incomes.
While we have been teased with signs of change in the claims data from time to time, the trend is still in force. Only if we start to see the numbers coming in above the comparable week for the past year for a few weeks would it be a sign of material change in trend, and a possible excuse for the Fed to bring back the Ghost of QE Past. The current data will encourage the Fed start the smoke and mirrors game of pretending to raise interest rates.