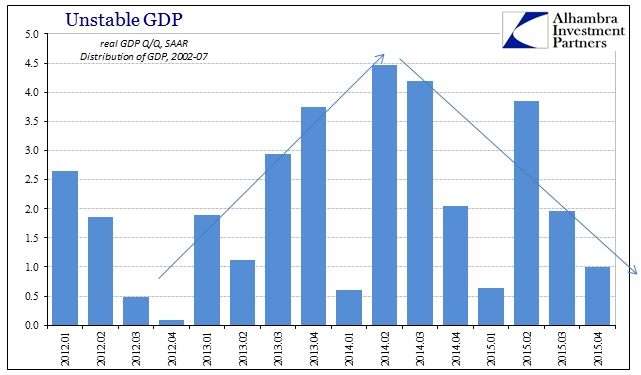
US oil prices (WTI) ended 2014 at $53.45 spot. Since the decline to that point was thought be a temporary deviation, the fact that WTI ended 2015 at $37.07 is inconceivable to that perspective. The reasons for that were the unemployment rate and GDP. Payroll expansion had just fired up into the “best jobs market in decades” while GDP was shooting up into the 5% range (since revised lower). The final reading on Q3 2014 GDP was released on December 23, 2014, and it presented the possibility of not just the highest growth rate dating back to 2003, but also in back-to-back quarters.
The U.S. economy grew at its quickest pace in 11 years in the third quarter, the strongest sign yet that growth has decisively shifted into higher gear…
The economy expanded at a 4.6 percent rate in the second quarter. It has now experienced the two strongest back-to-back quarters of growth since 2003…
While the pace of growth likely slowed in the fourth quarter, a rapidly strengthening labor market and lower gasoline prices should provide the economy with sufficient momentum in 2015 and keep the Federal Reserve on course to start raising interest rates by the middle of next year.
Under those circumstances, or really an interpretation of circumstances, there was no possible way that oil prices would remain around $50 per barrel. With the US economy poised to take off, “demand” would drive everything upward as orthodox theory had long predicted. “Inflation” would no doubt start moving up, finally, to the Fed’s 2% inflation target even if oil prices dragged for a little bit. It was believed an economy very close to overheating.
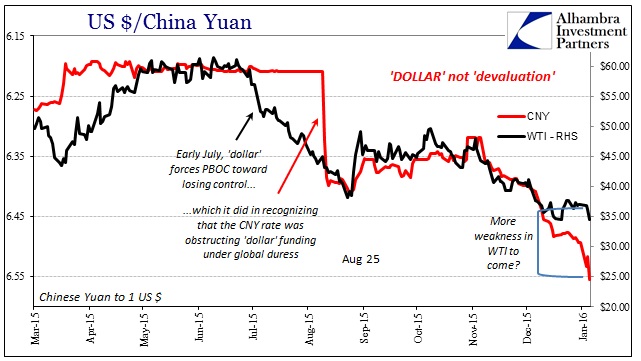
It was a peculiar arrangement of analytical priorities, given that it is markets that predict and statistics that often follow. Further, it wasn’t just oil crashing contradictorily; by a long shot. What we could reasonably take away from GDP, unlike the Establishment Survey basis for payrolls, was that perhaps the economy found some growth in the middle of 2014 but that there was no reason to expect it continue. A fuller read of even GDP in recent history left little doubt of highs and lows, but a curiously deficient distribution of estimates skewed uncomfortably low.
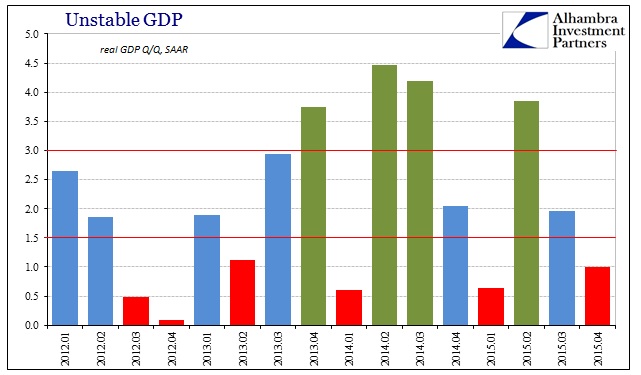
It helps to define terms, particularly when suggesting instability as a matter of systemic insufficiency and that these sorts of “good” quarters are the anomaly. Going back to the start of 2012, there were only four quarters above 3% while six below 1.5% (assuming that current estimates for Q4 2015 are correct); leaving six in that middle area which economists assume as some kind of “new normal.” So even on those terms, there seems too much down quarters than perhaps should be.
That point is truly emphasized once we start defining these expected tiers. Using GDP growth from 2002 through 2007 (Q3), we should expect an upper third distribution of 3.40% and a bottom third of 2.22%.
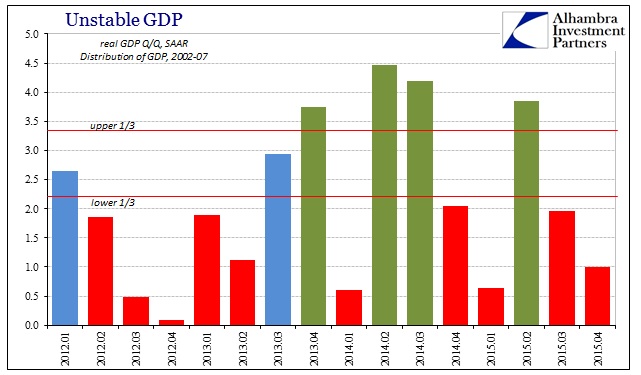
In this expected distribution, using a lackluster recovery all its own, we find the same four “upper quarters” but only two in the middle and now ten in bottom “third”; or just about two-thirds in the bottom third. The expected distribution gets even worse using GDP figures from the 1990’s. In that growth period, the upper third starts at 4.39% (so much for 5% being so terrific) whereas the bottom third ends at 3.06%. In this distribution, the last sixteen quarters are, indeed, skewed far too low.
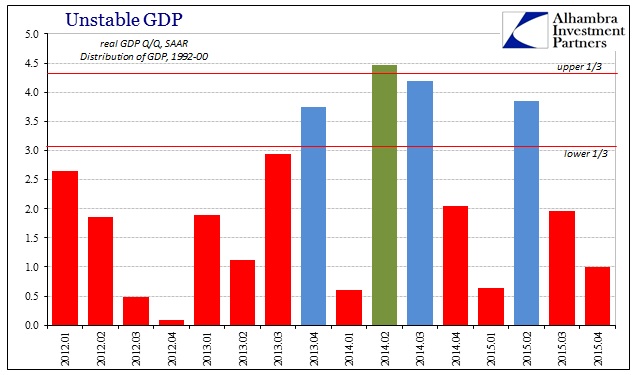
Only one quarter, Q2 2014 and not Q3 that was revised under “residual seasonality” to 4.2%, would fit in the upper “third” of the 1990’s distribution, while twelve quarters, or three-fourths, would be classified among the bottom “third.” In other words, it is entirely reasonable to suggest and declare that GDP growth on the high side has been anomalous since 2012 even after four QE’s to supposedly propel inflation, jobs and economy into the theorized recovery. Unless something fundamental has changed, that needs to be the baseline assumption.
If that defines instability, then, the interpretation of it goes toward economic risk. That is exactly the format the FOMC is taking in raising interest rates (or trying to) believing that risks are somehow skewed upward toward overheating. It does matter that they believed the same about 2015 since the basis for that belief is how I described above; that it turned more so fiasco than reaffirming the monetary faith only further bolsters the opposite case.
In fact, again using 1% as a stand-in for Q4 2015 (it wouldn’t make much difference if I used the +0.7% that GDPNow estimates at the moment), GDP growth for 2015 is actually slightly less than that of 2014 – a year that, overall, was itself a great disappointment. Last year only stands out on the high side because prior years were revised significantly lower (yet again, another sign of instability and structural weakness), allowing 2014 to claim the dubious distinction as the best of this “recovery” (before the major benchmark revisions in July, 2012 was believed to have grown by 2.78%).
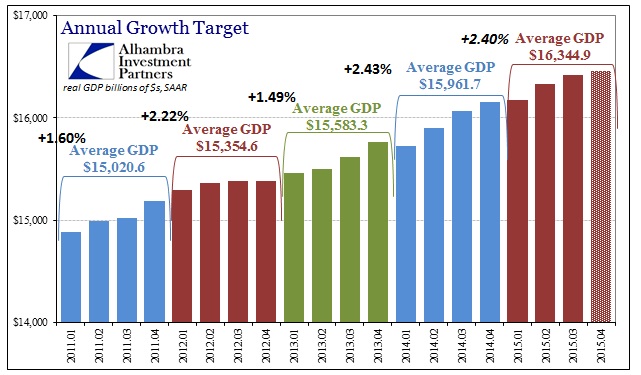
At the very least, GDP remains stuck in the same rut as the entire length of the “recovery” to this point, meaning claims about overheating hold no basis in GDP – services economy and all. Without GDP, however, there isn’t much other than bland orthodox faith with which to suggest economic upside.
Instead, we have every reason to suspect that something fundamental has changed. That view is provided by, as a start, the “inconceivable” further decline in oil prices. If we see the economy as at best unstable, the fact that it hasn’t already produced the theorized recovery makes sense; as does the potential for a worse condition. In terms of commodity prices and now more general financial conditions under continuing disarray (including and especially junk bonds suggesting not just an end to the credit cycle but perhaps a horrific one), they would be far more likely to appear and infect at greater speed and depth in a weakened economy than one about to be completely restored. A person with a chronic health condition is far more susceptible to getting sick; the economy is really no different.
And that is really the point here, namely that the economy has been suffering a chronic, structural disease that is actually quite obvious and apparent not just in the unstable GDP quarter to quarter but also how economists talk about it and extrapolate, wrongly, from it. There might be more reasonable debate as to what acute “sickness” has befallen the global version suddenly in 2014 and 2015, but the timing alone suggests that very pathology – it all fell apart with the “dollar.” Whatever economic burst that was gained in the middle of 2014 (which I still presume to be far more statistical overdrive than real) was transitory.
That would suggest why general conditions are turning more and more to the nasty; it’s not a poor basis with which to suggest recovery and success, it is no basis at all.
