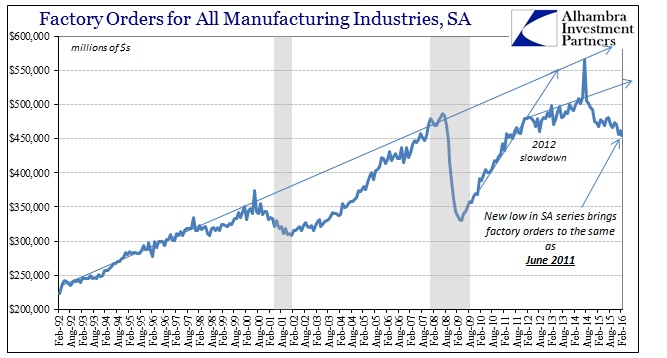
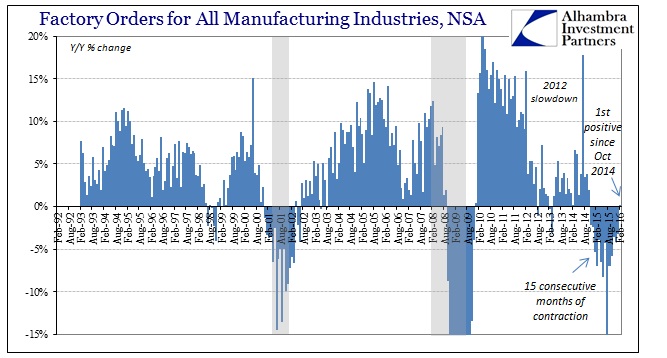
Factory orders were slightly positive year-over-year (not seasonally adjusted), the first plus sign in this category since October 2014. While that may seem like a positive or at least a step in the right direction, instead it just continues to suggest the a-historic trajectory of whatever economic condition this is. To be even with February 2015 is no feat at all, as revealed by comparison to prior years as this slowdown just continues to accumulate. The seasonally-adjusted level, for example, fell to the lowest estimated total since the middle of 2011, as the ARIMA X-13 factors clearly assign February’s positive number to nothing more than the month’s 29th day.
In that sense, the full scale of the trajectory doesn’t fit into the traditional numeric scheme. Comparing year-over-year growth can pick up recession and contraction where it is expected that recession will look like past recession (V-shaped that fits within a single calendar comparison). What we find now especially in especially the manufacturing sectors is itself an anomaly.
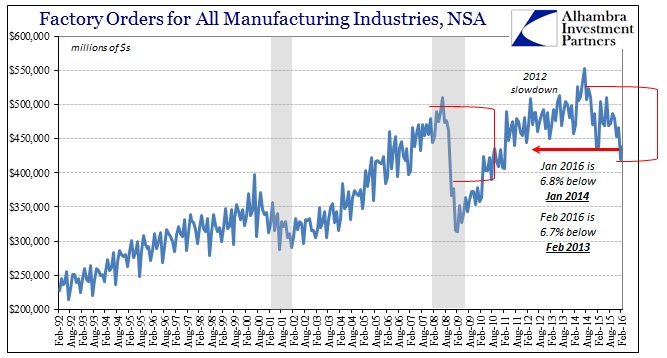
Where factory orders for February 2016 are 0.1% above February 2015, they are 6.8% below February 2014 and, far more important, 6.7% less than February 2013 (and February 2012). In seasonally-adjusted terms, factory orders are 11% below the June 2014 peak (which does not count the burst of activity in July that year due to Boeing). That 11% encompassing 20 months (and counting) compares to the much sharper -32% during the Great Recession crammed into just half that time (10 months) starting July 2008. Even the dot-com recession was -13.1% limited to 16 months in total.
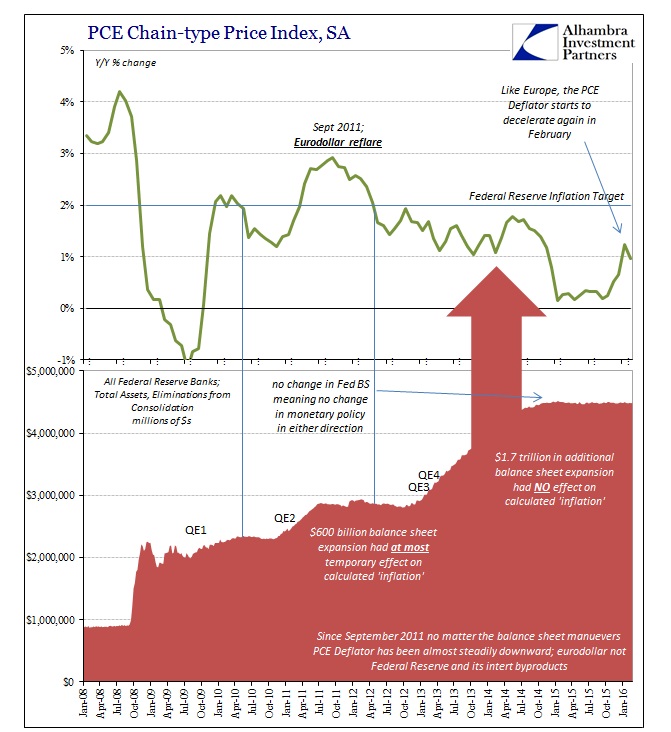
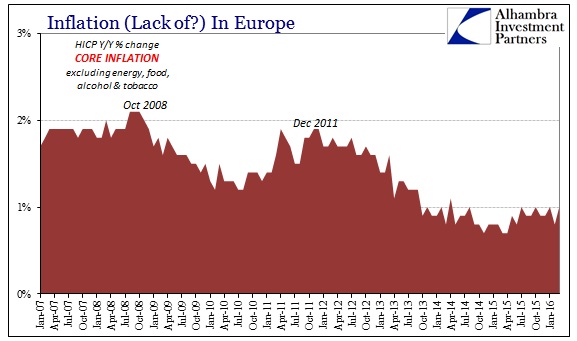
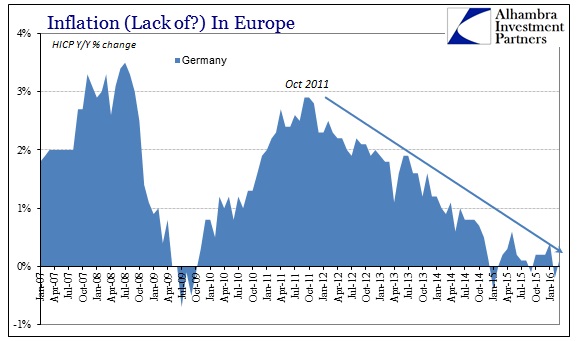
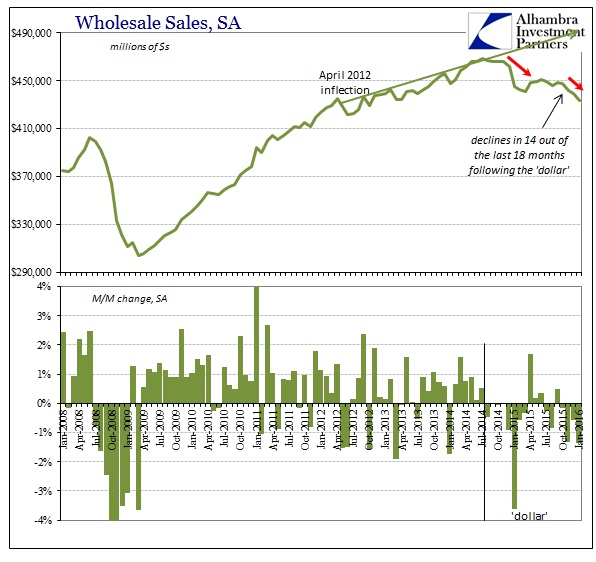
That suggests, strongly, the “manufacturing recession” isn’t actually recession, which could be (likely is) a much worse proposition. As you can plainly observe on the chart immediately above, this discrepancy actually dates back further than just the contraction part of the past almost two years; factory and manufacturing activity shifted in late 2011 and early 2012 and hasn’t been the same since though at first that meant positive numbers taken for “growth.” That is entirely consistent with “inflation” observations here and elsewhere that also suggest both the same timing and a likely shared causation – global monetary conditions. It proposes that the slowdown began around that time in 2011 or 2012 and that the contraction we find now isn’t again recession but just the continuation of the gradual reduction or slowdown past the zero growth “boundary.”
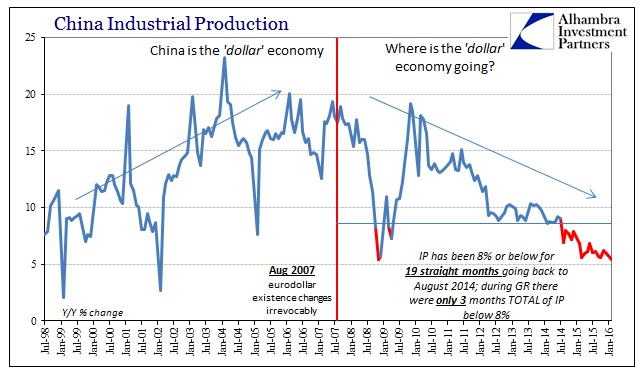
Since the mainstream takes anything that isn’t conforming to historical recession as if it had to be growth by default, this oddity muddies interpretations of the circumstances. In my view, it is the same manifestation as we see elsewhere related to the “dollar’s” decay. The timing and the replication of such an obvious a-historical pattern all over the world leaves no other possibility. It also gives us an answer as to why “stimulus” has had no effect, as this eurodollar first order governing dynamic supersedes whatever little central banks might have otherwise achieved.