Economists and policymakers continue to count on a second quarter surge in economic activity to ignite momentum for the rest of the year. The first revision to Q2 GDP comes on Thursday, so that will be the first test of the thesis. Given the inordinate volatility in the data set GDP could conceivably amount to almost anything at this point. In hard dollar data, however, there is much less indication of rebound let alone ignition.
WalMart sales have already disappointed, but at a 0% same store sales comp that counted as an improvement in second derivative terms. Last week, Target released its quarterly figures showing an intriguingly similar 0% US comp.
Everything seemed to be growing and recovering at Target after the beating the company took in the Great Recession. For “some” reason, that trend just stopped in mid-to-late 2012, with Target unable to gain any traction in revenue growth since (just like WalMart). There were the usual parables of extreme weather and then the credit card theft (which we are still learning as deeper than thought previously) but those were just “convenient” excuses to mask the underlying weakness in consumer trade.
Target’s second quarter details, however, give us several important clues as to what is really happening. In comparable store terms, the average number of transactions fell 1.3% from the second quarter of last year, but that was mostly in-line with recent results. In fact, in August 2013 Target reported a drop of 1.4% in the number of transactions from the same period in 2012.
However, the average selling price per unit advanced (not fitting the orthodox definition of “inflation” since commodity prices are not “broad” enough) at almost double the rate, from 1.6% (2013 over 2012) to 3% currently (2014 over 2013). With prices increasing noticeably more recently, the average units per transaction declined 1.7% (from 2013) where in 2013 the average gained 1% (over 2012). That meant, on a strictly nominal basis, the average transaction amount only rose 1.3% in Q2 ’14 where it grew double the rate, 2.7% in Q2 ’13.
That is revenue for Target, but on an economic basis that simply means consumers paid more nominal dollars to Target (+3%) to receive less stuff from Target (-1.7%). Since the company retails not just clothing and food but electronics and others, it seems as if the “offsetting” price declines in electronic goods is not enough to render nominal changes benign as it does in the CPI and PCE deflator.
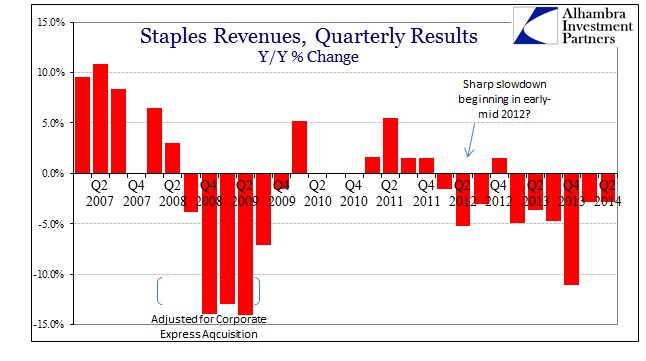
Shifting somewhat to include small business spending, Staples continues to see drags in almost all of its business and stores. The one bright spot has been Staples.com, which, if you recall recent comments offered around the last release of retail sales, was supposed to be the new trend. The idea was that same store sales are perhaps not encompassing enough as it excludes business transacted online, providing, somewhat, an excuse for softening and very much disappointing traditional measures.
Indeed, sales at Staples.com grew 8% in Q2 ’14 over Q2 ’13, which provided a boost for the flagging company. But that was not nearly enough, as comparable North American sales fell 5%. Given the proportionality of bricks and mortar to online, overall sales for Staples declined a rather stark 5.8% (also factoring the loss of sales at closed stores).
Despite sales levels at both Staples and Target which continue to drop and disappoint, as well as contradict economic observations of broad-based rebounds and attainment of the long-sought healthy trajectory, both companies continue to add merchandise inventory at seemingly unhealthy rates. Overall sales grew at a paltry 1.7% for Target (including the addition of new stores) but the company’s inventory line on its balance sheet rose from $8.44 billion to $8.92 billion, or an increase of 5.7%.
At Staples, despite actual declines in total revenue of 6% and closing stores, merchandise inventory actually grew slightly.
What we cannot tell from those figures is the physical quantity of inventory at either retailer, as these are reported dollar figures of the “value” of held inventory. Given the price gains being passed along, at least in Target’s numbers, we can reasonably assume a similar dynamic in the inventory segment (and also reasonably extrapolate that to Staples and other retailers).
In other words, another example of what looks like positive numbers being masked by the agglomeration of price changes that may or may not be appropriate as “deflators” for broad and more generic calculations of economic statistics. On a granular level in actual dollars, consumers appear stressed to the point of being unable to afford even small increases in the costs of non-discretionary and less-discretionary items, while the companies that are “forced” to pass along cost increases are themselves beset by the same problem. Gross margins for both retailers declined in Q2 ’14 from Q2’ 13, with Target’s margin falling a full percent from 31.4% to 30.4%.
Economists and FOMC members can talk about new calculations for labor metrics and marking economic expansion with general positive numbers, but the reality is far different in the actual, living and breathing economy. Consumption flows from production (which includes the service sector), and in productive growth lies wage gains as wealth is created and established. The lack of consumption shown here and in almost every other corner illustrates quite clearly that not only has the Fed’s active approach to stimulate “aggregate demand” not done so, the economy is displaying a very real lack of wealth creation.
Click here to sign up for our free weekly e-newsletter.
“Wealth preservation and accumulation through thoughtful investing.”
For information on Alhambra Investment Partners’ money management services and global portfolio approach to capital preservation, contact us at: jhudak@alhambrapartners.com


