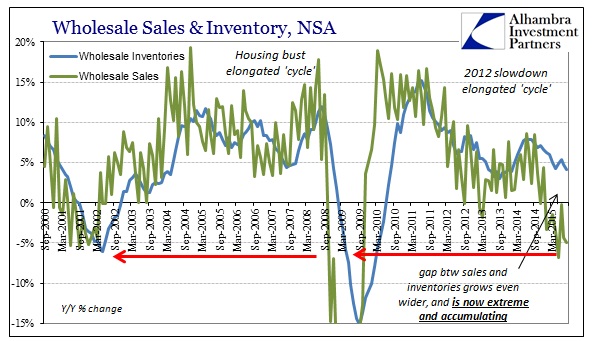
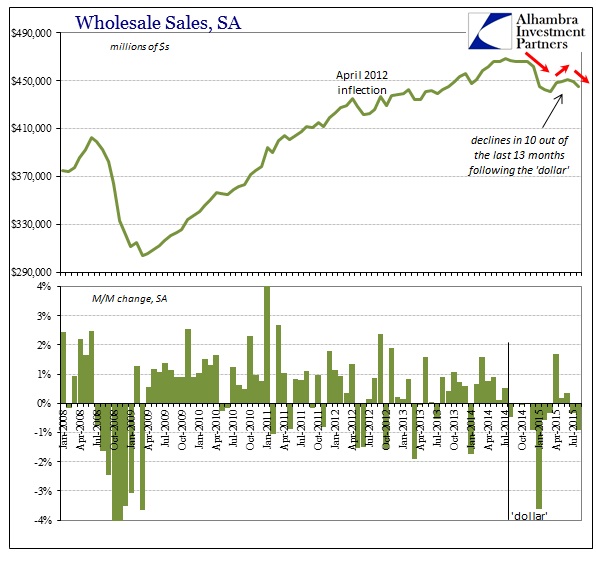
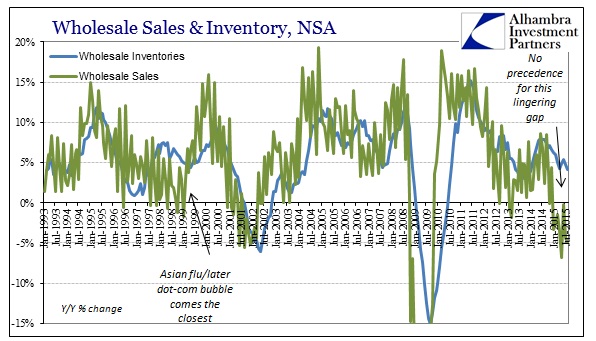
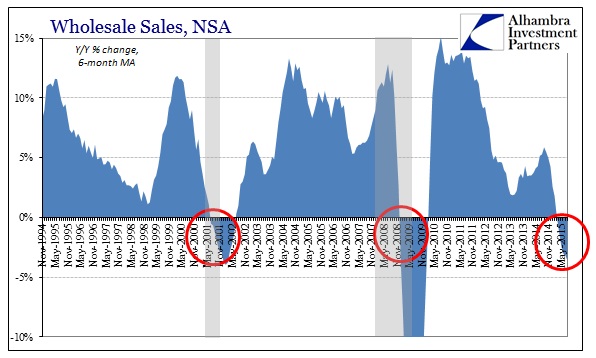
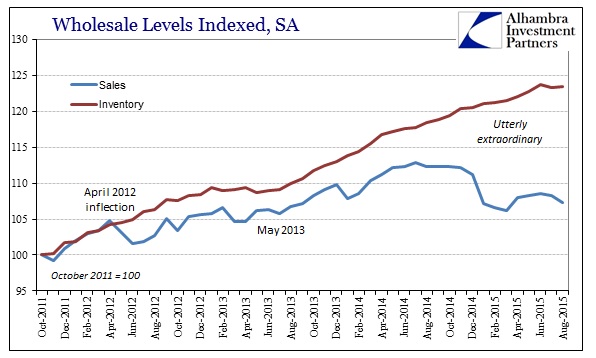
What is taking place on the wholesale level of the supply chain is simply unprecedented. Admittedly, the current iteration of the wholesale data series only dates back to 1992, so there is some possibility of a similar disparity at some point in actual economic history. However, at present, inventory continues onward with only a slight deviation and slowing recently while sales contract further and further. Year-over-year, wholesale sales declined 5% in August, marking the second worst monthly drop of the recovery behind only May. Worse, the outlines of the “dollar” waves are clearly visible and not just in the non-adjusted annual rates of change; even the seasonally-adjusted figures show the big contraction of early 2015, the slight rebound in the middle and now a renewal.
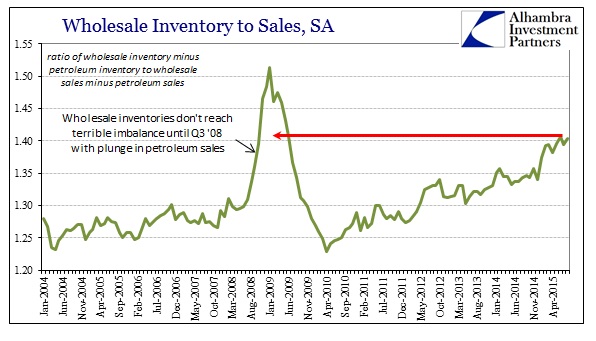
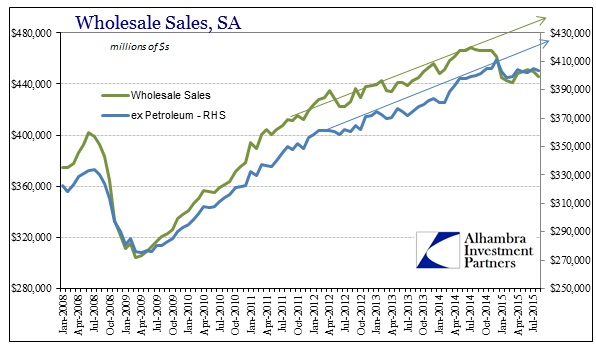
The second consecutive monthly decline in the seasonally-adjusted figures makes now ten out of the past thirteen months. Immediately, analysis will wander to petroleum given the close correlation between “dollar” and oil prices, but wholesale conditions, both sales and inventory, away from crude presume similar and broader strain. That suggests that while petroleum acts as an amplification of the downturn it is not the only expression of it.
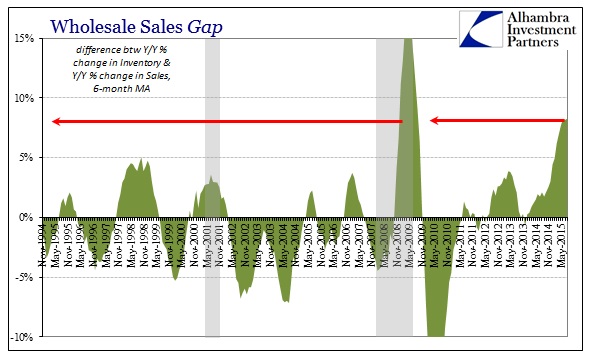
Perhaps that narrative is more constructive in recalling the “other” end where economists and media were far less concerned about petroleum activity when it was so clearly boosting economic numbers prior to mid-2014; if oil was a good part of the way up, the same is true on the way down. In any case, the deceleration in goods sales is unquestionably broad and historic. Without any historical background correlation it is difficult to place any potential causes to the grand imbalance – and it is becoming nothing less than that. The only period close to the current view was early 2009, but that was a matter of sales collapsing much faster than inventories (meaning inventories were themselves contracting too).
The only other period in the data series that approaches this level of disparity was during the Asian flu/later dot-com period. But in that case wholesale sales only contracted intermittently, with the 6-month average slowing only to 1% by early 1999. In 2015, contrarily, wholesale sales are contracting month after month after month while inventories no longer have any bearing, suddenly departed of all prior close correlation with sales. As you can clearly see below, sales levels primarily dictate inventory growth (or contraction) with inventory operating on a much smoother tactical allocation. That is, after all, one of the great functions of the wholesale supply level, to mitigate and really mediate production and end consumption.
The traditional recession pattern thus formed out of that pliability; businesses are reluctant to cutback lest any drop in sales be the usual zig zag of variability. Instead, at the wholesale level in particular, firms will hold on to inventory even when sales depart their expected course for more than the “usual” ups and downs, Then, this disparity grows out of abundance of caution against not being able to fulfill any possible sudden resurgence in “demand” – better to be stocked and thus able to supply enough than be too cautious and unable to fill, leaving you quite replaceable. In a true recession type cycle, wholesale business eventually realizes the full gravity, that end sales and demand are not forthwith, and the whole supply chain sharply reacts to restore inventory to sales (leading, typically, to both sales and inventory falling together with the latter greatly outpacing the former).
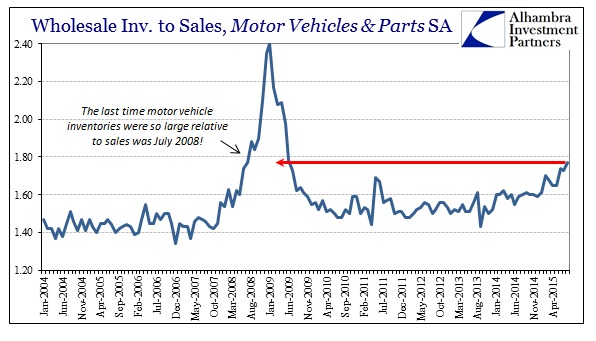
The only answers I can come up with that can reasonably absorb this unusual existence all trace back to artificiality (which would be expected of these “recovery” conditions). The first is autos; especially given the relative strength in auto production and sales far apart the rest of the consumer arena. That isn’t surprising, either, since that is the one sector most directly impacted under renewed and bubble-type debt financialism. But even in autos the discrepancy is stark and gaining – wholesale auto sales in August were down 2.7% month-over-month (seasonally-adjusted) and up just 2.6% (SA) year-over-year. Auto inventories, however, were down only slightly, -0.3% M/M but up an enormous 13.5% Y/Y.
The inventory-to-sales ratio in autos has thus jumped to an alarming proportions; 1.77 from 1.73 last month and 1.60 in August 2014. The last time the inventory-sales ratio in the motor vehicle segment was as stretched was July 2008.
As is plain in the chart above, that upward turn began January/February 2015. What are autos waiting on so far this year? I think it has to be the other primary artificial influence of “transitory.” That is then, once again, the primary danger upon renewed deterioration in the sales environment at both retail and wholesale. Once “transitory” is long forgotten as a kind of mysticism and comic hypnosis, inventory becomes not just a huge problem but the only problem. At that point, feedback effects make the adjustment not just painful but geometrically so (and Janet Yellen’s repeated assurances no more than the daily and misbegotten noise). You can see that, too, on the chart immediately above (or any of the others before it) where the inventory-sales ratio starts to rise (in 2008 before June) and then suddenly spikes. That is the full recession process whereby relatively small fine-tuning cutbacks in production lead to reverberations in “demand” and thus back and forth until the adjustment process between inventory and sales becomes the sole focus – with both accelerating downward together.
If the inventory problem is thus far more than petroleum effects and now well into infecting the auto sector, that is far beyond “transitory” and dismissible as “aberration” or “anomaly.” This is a seriously recessionary setup that is only waiting the inevitable adjustment. The “dollar” has already placed bets, a second time, on which kind of adjustment.

