The Fed’s announcement that it will soon begin to shrink its balance sheet is the most important step that it has taken with monetary policy since it first started outright purchases of Treasuries from Primary Dealers in March 2009.
Meanwhile, the Fed’s balance sheet and several key banking indicators are currently in the “calm before the storm.” Bank lending continues to slow, but it is not yet declining outright.
Measures of speculative financial lending for the purposes of financial engineering have signaled that the game is over. But they have not yet signaled that collapse is imminent. We should start to see those signs once the Fed actually begins the process of shedding assets. That will force the Treasury to sell additional debt to the public to pay off the Fed for the bonds it is redeeming. That supply will pressure the market.
As that occurs, money will begin to be extinguished. Money supply growth will slow or even shrink. Bank lending for financial speculation will all but disappear. There will be downward pressure on bond prices with the mirror image rise in bond yields and short term interest rates. Likewise, stocks will also come under increasing liquidation pressure.
A deal on the debt ceiling won’t happen until the Treasury has run out of money and has borrowed all that it can from internal accounts. The debt ceiling will then be raised at the 11th hour or, knowing Congress the 12th hour. The Treasury will then immediately flood the market with new supply to raise the money to pay back the internal funds it raided to keep the government operating while the debt limit prevented new borrowing. The markets will then be primed for a severe decline, perhaps a crash.
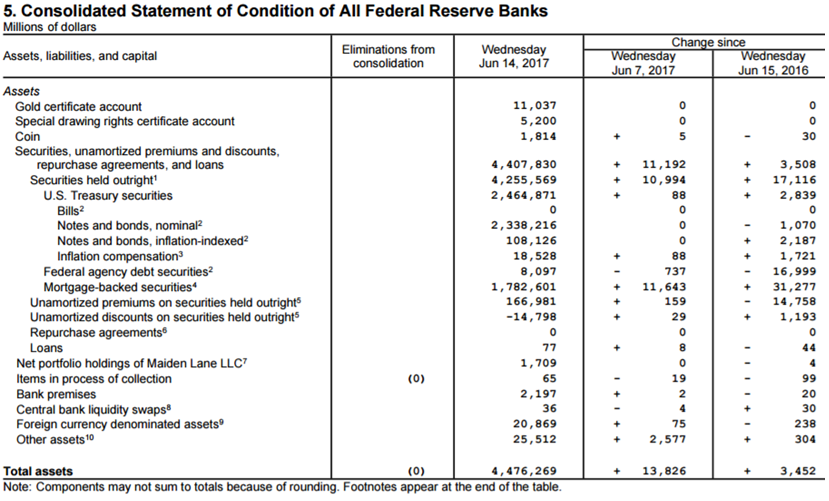
Fed Assets
Over the 4 weeks ended June 7 the Fed’s assets rose by $9.2 billion. $3.5 billion of that came from settlement of the Fed’s MBS replacement purchases. More of those will show up in next week’s statement. The balance of the increase over the 4 weeks was in Other assets, which is mostly accrued interest. 
The size of the Fed’s balance sheet fluctuates between $4.39 and $4.50 trillion each month as MBS are paid down and then more are purchased to replace the paper that was paid down. Aside from these minor fluctuations, the overall size of the balance sheet has essentially remained flat. But on the other side of the coin, the Fed continues to pump cash into Primary Dealer accounts via the mid month MBS purchases. The dealers use that cash for whatever they want, including the purchase of more MBS, or Treasuries, or even stocks on occasion.
When the Fed begins shedding assets at some point later this year, it will do so by not purchasing MBS that are paid down each month, and by allowing some of its Treasury holdings to mature without rolling them over. The Treasury must pay off these maturing notes and bonds. That will pull money out of the system when the Treasury sells new debt to the public to raise the money to pay off the Fed. The Fed will get cash in exchange for its maturing holdings. That cash will have come from the dealers and investors who bought the new paper. The money will be paid from their checking accounts, which will in turn reduce reserves at the Fed because that’s where the banks hold much of the cash. So both the Fed’s assets and liabilities–the bank reserve deposits, will shrink by a like amount. Treasury supply will constantly increase, and cash in the financial system, which is the fuel for demand for Treasury and other securities will constantly decline.
There are those who argue that this won’t be bearish. To them I say, “You wish!”
But for now, we just wait for the start of the program within a few months. There’s time to get your affairs in order, or in other words, reduce your exposure to stocks and bonds by regularly selling stocks and dramatically shortening bond maturities.
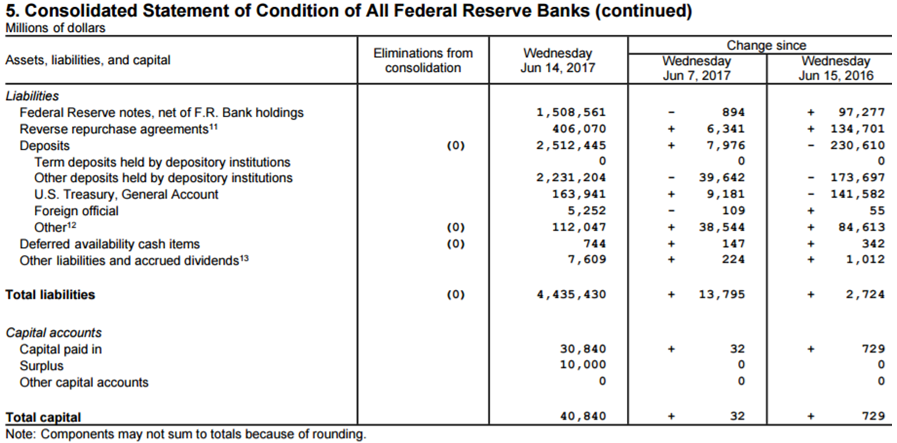
Liabilities
As of June 14, 2017, the US Treasury’s deposits at the Fed totaled $163.9 billion, down $10 billion from 4 weeks prior. The Treasury has been dipping into its cash, not to pay regular outlays, but instead to reduce what the government owes the Social Security Trust fund. This debt to itself is included in the total debt subject to the debt limit. 
By paying down the debt to Social Security, the government has enabled itself to continue selling new debt to the public at approximately the rate forecast by the TBAC.
Regular bank reserve deposits, called “Other deposits held by depository institutions” were down $16 billion over the 4 weeks ended June 14. Federal Reserve Notes (cash) outstanding rose $6.9 billion. In essence, that is the amount of cash that was withdrawn from bank accounts and converted to paper money.
Reverse repos outstanding were down by $1.5 billion. That’s insignificant.
The “Other deposits” line item includes the Primary Dealers and the GSEs—primarily Fannie and Freddie. They rose $28.1 billion over the 4 week period. That’s a big number. Much of it was from the Fed’s monthly MBS settlements sending cash to Primary Dealers. It will leave their accounts over the next few days.
Other line items had insignificant changes.
Total liabilities rose $9.2 billion, matching the increase in assets.
So the Fed’s balance sheet remains stable for now. But a storm is coming. This is the calm before the storm. Take this time to batten down the hatches.
We’ll look at US banking indicators in a followup report.
This report is derived from Lee Adler’s Wall Street Examiner Pro Trader Monthly Macro Liquidity reports.
Lee first reported in 2002 that Fed actions were driving US stock prices. He has tracked and reported on that relationship for his subscribers ever since. Try Lee’s groundbreaking reports on the Fed and the Monetary forces that drive market trends for 3 months risk free, with a full money back guarantee. Be in the know. Subscribe now, risk free!


