
Nearly 15 years ago I developed an indicator to track the amount of cash which the Fed was pumping into Primary Dealer Trading accounts. That indicator has proven its mettle over time. It is one of the best predictors of stock market behavior because the Primary Dealers literally “make” the markets. Market price levels reflect how much cash the dealers have on hand to ignite the cycle of securities inventory markups and markdowns that drive market price trends.
The indicator is composed of the cumulative value of operations which the Fed conducts directly with Primary Dealers. It measures the flow of cash into Primary Dealer accounts that comes from the Fed’s purchases of securities from them.
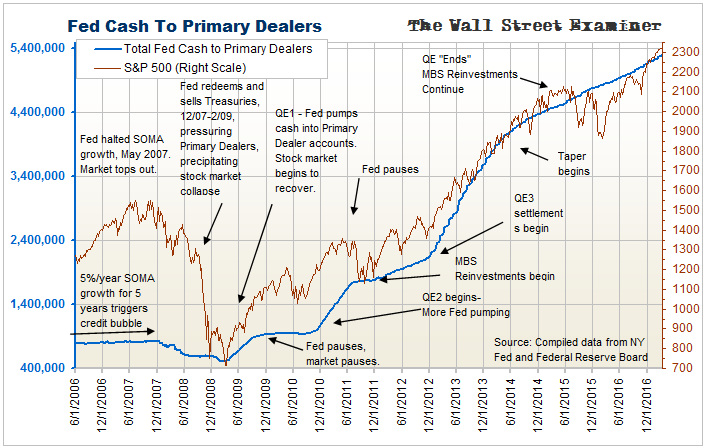
The growth of dealer cash under the Fed’s last program of QE was the fastest in history. It was a singularly bullish influence on stock prices. Flush with cash from the Fed, the dealers marked up their inventories of equities and sold them to their customers, particularly hedge funds and institutions. They were also flush with buying power thanks to their own rising cash levels and zero financing costs. The Fed made sure that cash and leverage was were the name of the game. The Fed rigged the market to go up.
When the Fed ended QE, it did not end its purchases altogether. It continued buying MBS–Mortgage Backed Securities–because its own holdings of that paper were being paid down every month. To maintain its total assets at a static level after QE ended, the Fed elected to continue buying MBS from the dealers. It buys just enough each month to replace the MBS that were paid down from its balance sheet in the prior month. This typically amounted to around $30-$35 billion a month, and up to $40 billion recently.
That’s not the hundred billion or more that the Fed was buying each month under QE. But it’s enough to put a bid under prices, particularly in the third week of the month. That’s when the Fed settles its purchases from the past month or two. That is when the cash hits the dealer accounts. In March, it’s this week.
The MBS purchases add to the cash flowing into the US markets from Europe and Japan. QE and NIRP in those markets are driving cash out of their home markets and to the US. Between those flows and the Fed’s MBS purchases, there has been enough cash around to keep the stock market bubble intact for now.
The Trump Administration’s recent spend down of Treasury cash has added to that. It removed Treasury supply from the market and added cash to the accounts of the holders of the Treasury paper that was paid off. They used some of that cash to buy stocks. It was enough buying at the margin to drive the recent meltup.
The slope of the Fed cash pumped into dealer accounts has turned flatter since the Fed reduced its purchases to just the MBS reinvestments beginning in November. Because this indicator reflects the Fed’s cash infusions to Primary Dealers, this graph will continue to have a slight upslope for as long as the Fed continues the MBS replacement purchases. That’s in spite of the Fed’s balance sheet being flat. It will stay that way until the Fed starts allowing some of its holdings to be paid down or mature and roll off the balance sheet.
This indicator upticks each month with the Fed’s regular mid month MBS purchase settlements. That cash helps to put a bid under stock and bond prices during the settlement periods, which are in the third week of the month. The March settlements start Monday March 13 and continue through March 21.
The total amount was not available as of this writing. The Fed will post the data for March settlements later today. I have estimated it at $35 billion, based on purchase amounts and remaining outstanding balance of purchase commitments as of last week. This is less than last month’s $41 billion. Whether the amount is $35 billion or $40 billion would make no difference in the big picture or in the short run effect on the market. Either way, it’s normally enough to give the markets a little boost during or just after the settlement week.
The February settlement was the last to result from the refi boom last summer when mortgage rates were at their lows. The monthly amounts are now diminishing sharply. Forward purchase contracts for the last 4 weeks totaled $25.4 billion. That’s down from a peak of $40 billion on December 21. For the period March 13-April 12, the Fed has scheduled just $18 billion in purchases. That’s the lowest since $16.7 billion purchased in January 2015.
The Fed’s MBS purchases increased after that because mortgage rates were declining. A new refi boom ensued. Those refis resulted in more mortgages being paid off. That in turn caused more paydowns of MBS holding those old mortgages, including those on the Fed’s balance sheet. As the amount of those paydowns increased, the Fed was forced to raise its MBS replacement purchase rate, putting more cash into dealer accounts.
That process has gone into reverse in recent rise as mortgage rates from their Q3 2016 lows. There have been fewer mortgages paid off, and smaller paydowns of the Fed’s holdings in the past 2 months. As a result, Fed MBS replacement purchases are plunging.
This time, the market isn’t likely to be rescued by lower mortgage rates again. The 10 year yield is poised to break out above the major trendline at 2.60. Once that happens, bond yields and mortgage rates are likely to skyrocket. The Fed’s MBS purchase rate should drop to $10 billion or less as refis disappear.
That $10 billion would be the amount of normal purchase mortgages. Since most of the new purchase money mortgages pay off seller’s old mortgages, there’s still a base level of mortgage payoffs, which would translate into MBS paydowns. But at $10-12 billion per month, the Fed’s replacement purchases would have no measurable market impact.
This is happening when the Treasury has spent all its extra cash in support of the markets. The debt ceiling drama will throw an element of uncertainty into the picture if the Treasury must suspend borrowing. That temporary reduction of supply could help support prices. But once that ends and the Treasury returns to selling debt in the market, bond yields and mortgage rates should resume their rise. Refi activity will dry up completely, and the Fed’s MBS replacement purchases won’t be enough to float a rowboat, let alone the stock market.
This report is derived from Lee Adler’s Wall Street Examiner Pro Trader Monthly Macro Liquidity Reports.
Lee first reported in 2002 that Fed actions were driving US stock prices. He has tracked and reported on that relationship for his subscribers ever since. Try Lee’s groundbreaking reports on the Fed and the Monetary forces that drive market trends for 3 months risk free, with a full money back guarantee. Be in the know. Subscribe now, risk free!

