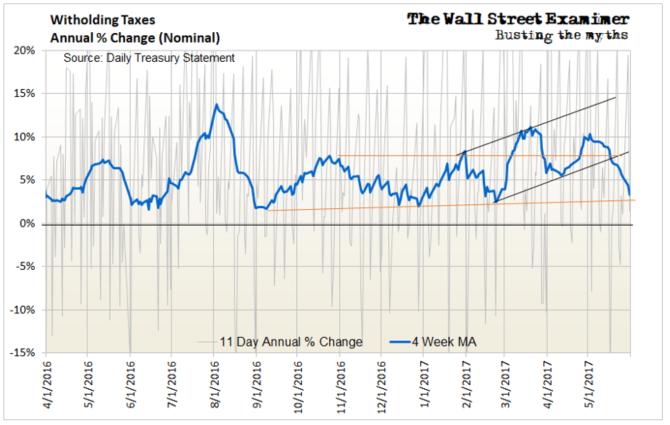
May Federal tax collection data sent negative signals. The surge in April withholdings turned into a purge in May, as collections decelerated sharply. The weakness in nonfarm payrolls was no accident.
At the same time, weak excise tax collections in May continued a long weakening trend in excise taxes. That data indicates that the US economy has been week, despite employers riding high in April. They got shot down in May.
If the weakening tax collections are any indication, additional economic data should disappoint as the releases come in this month. The jobs data was just the first negative surprise.
If the numbers are weak enough and if the tax data weakens again this month, it could throw the Fed off course from its determination to start shrinking its balance sheet later this year or early next year.
All signs had pointed toward the markets topping out this summer, with the Fed moving toward shrinking its balance sheet. However, if the economy materially weakens and the Fed doesn’t move to tighten, it could allow the stock market bubble to rage on longer than we currently expect. So we’ll need to watch the data and pay close attention to the direction of Fedhead public ruminations. So far, they’re still leaning toward a move to start shrinking the balance sheet. If they make that move, it should finally end the raging asset bubbles.
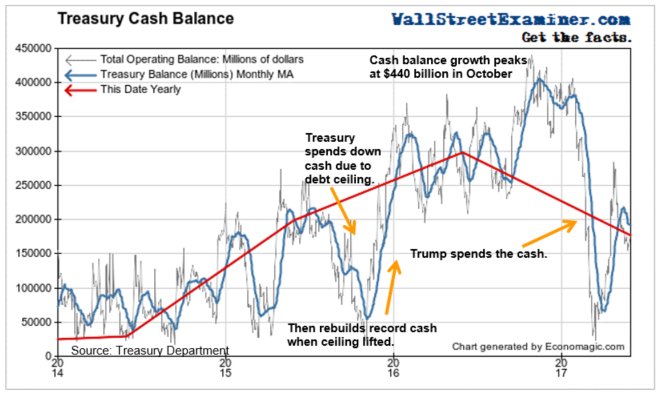
Meanwhile, the Federal Government continues its march toward Debt Ceiling Doomsday, when it runs out of cash because it can’t borrow to cover its deficit spending. In May the government was forced to use much of the massive cash pile that came in from April taxes. But the Treasury still held $169 billion in cash at the beginning of June. That can tide it over through a couple more months of deficits. At the same time the US won’t be able to sell new debt as it bumps up against the debt ceiling. This artificially imposed shortage of Treasury supply will remain a bullish factor for both bonds and stocks as long as the debt ceiling constrains the Treasury from issuing new supply. That bullish influence will be reversed with a vengeance when the debt ceiling is lifted and the Treasury can start issuing new debt.
The government will need to raid internal accounts such as pension funds to pay the bills as the debt ceiling impasse drags on. Experts suggest that the debt ceiling must be raised by October 2 when a big military pension fund payment comes due. The Federal government may need to borrow as much as $200 billion over the course of October and November, with much of it loaded into early October. That’s likely to destabilize the markets during that time.
In the unlikely event that they get a deal done to raise the ceiling earlier than that, that would reduce the bearish implications when supply returns, but at the same time, any return of supply on a regular schedule will end the shortage of paper currently boosting securities prices. The sooner the debt ceiling is lifted, the smoother the transition. The longer the impasse goes on, the more violent it will be.
The US Treasury’s cash balance correlates inversely with stock prices. The chart below shows the relationship. When the Treasury spends down its cash, particularly to pay down outstanding government debt, that tends to lift stock prices. When the Treasury builds cash by selling more debt, it sucks cash out of the markets, and stock prices typically decline.
We have talked about Trump’s spending spree and its impact on the market. That spending spree ended in March. The Treasury rebuilt some cash in April. The effect on the stock market was muted in April because the cash build did not come from increased Treasury supply which would have increased downward pressure on securities prices. 
The buildup in cash in May was not due to increased debt sales. It was due to the huge wave of taxes collected in April which was still being processed and which had yet to be spent.
The Treasury spent some of that April cash flow to pay down a bit of debt in May. That helped to drive stocks to new highs in May as investors holding Treasury paper that was paid down got a slug of cash back for their redeemed government paper. They used some of it to buy Treasuries in the market, which pushed bond prices up and yields down. They also deployed some at the margin to purchase stocks, pushing stock prices to new highs.

Withholding Tax Collections
April’s surge in withholding taxes became May’s dirge. The annual growth rate fell to 4.3% in nominal terms. That’s probably less than 2% real growth based on recent salary inflation data. This is a far cry from the ridiculous 9% gain at the end of April.
As crazy as that surge was, it topped out below the March peak, which was even more cray cray. The May plunge has broken the low of the April pullback. As a technical analyst first, any time I see a lower low after a lower high, my antenna goes up. This could be a forerunner of trend change.

We’ll take a deeper dive into the May tax data in a followup report.
This report is derived from Lee Adler’s Wall Street Examiner Pro Trader Monthly Federal Revenues Report.
Lee first reported in 2002 that Fed actions were driving US stock prices. He has tracked and reported on that relationship for his subscribers ever since. Try Lee’s groundbreaking reports on the Fed and the Monetary forces that drive market trends for 3 months risk free, with a full money back guarantee. Be in the know. Subscribe now, risk free!


