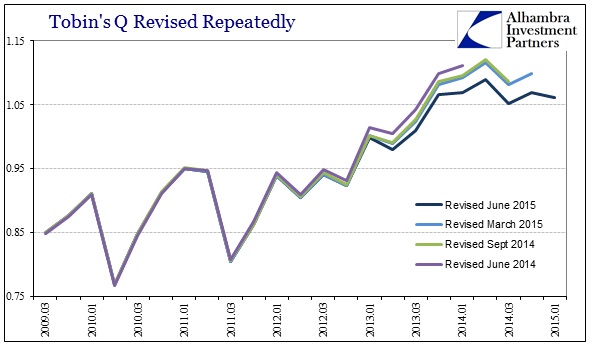
Yesterday was the quarterly release of the Financial Accounts of the United States (Z1), formerly titled as the Flow of Funds, which means we get updates on the asset bubbles through Q1. That starts with equity valuations, with the components to Tobin’s Q being revised all over the place. The Q ratio is made up of the total value of equity liabilities, nonfinancial (as a proxy for stock prices and values), divided by estimated net worth of nonfinancial corporations.
That makes intuitive sense as rising values in stocks if supported by rising net worth would tend to argue in favor of a fundamental advance opposed to something more artificial. When equity values far outstrip net worth, the vision of an asset bubble is much stronger.
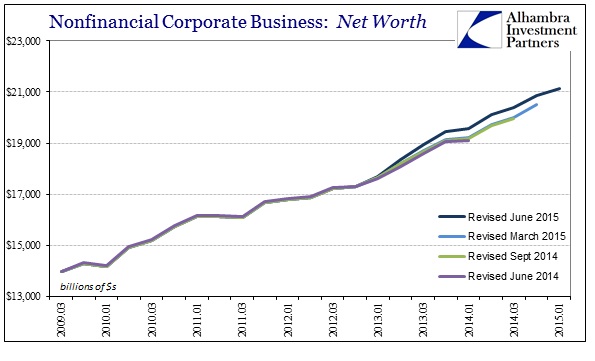
The Federal Reserve has not been able to sit still upon its estimates for these components, however. Revisions are a constant source of clouding comparisons, but they seem to have taken heightened sensitivity really in the past year or so. In the first part, corporate net worth, the Fed keeps upping the estimate not just in trend but also in revision.
The latest adjustment in June 2015 is rather astounding, amounting to a $331 billion boost to net worth in Q4 2014 alone. What calls into question its veracity is the timing, noted easily on the chart above – the quarter immediately following QE4. In other words, are we noting an actual increase and upward revision in corporate fortunes due to actual and sustainable advancements in their economic placement and function, or is this a baseline assumption of monetarists charitably refiguring their own work?
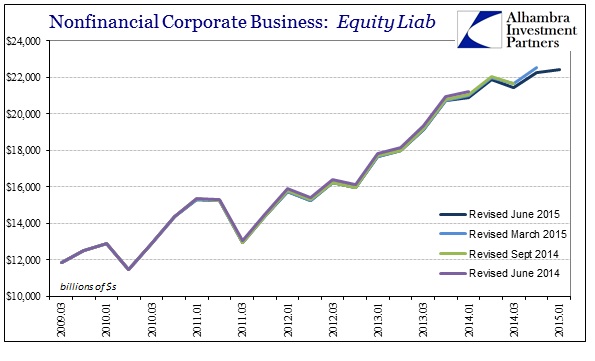
That may be partially answered by what comes next, the revisions in the numerator of the Q ratio. While net worth has been moved to a much higher trend, corporate equities have been somehow been reworked in the opposite direction.
Again starting around Q1 2013, the Fed appears to be combining new estimates of how QE was better than thought for corporate activities but at the same time not quite so robust on equity prices. The net result is that Tobin’s Q ratio, while still historically elevated, has flattened out and even declined in its trajectory for the last year (Establishment Survey trend-cycle effect?).
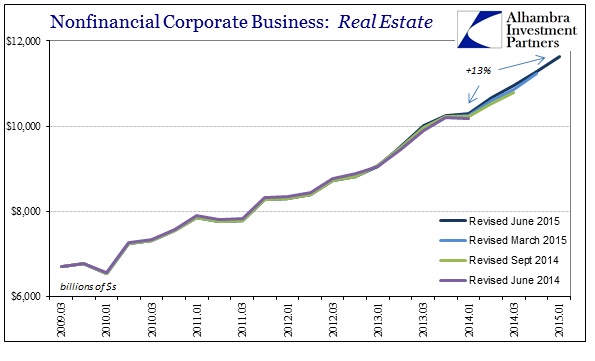
Revisions aside, a good part of the increase in corporate net worth has been due to rising real estate values (likely prices alone rather than efficient acquisitions). The new Z1 figures show that corporate real estate assets have risen by 13% since the start of 2014, meaning that corporate net worth is being pushed higher through another asset channel.
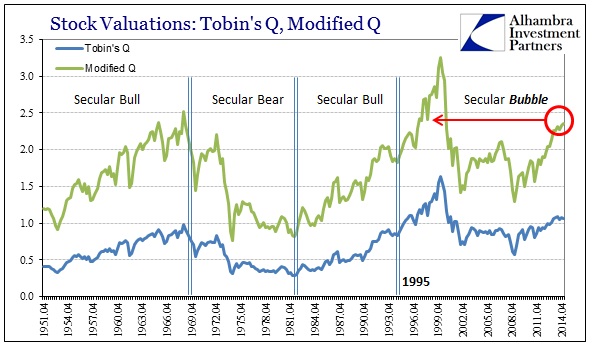
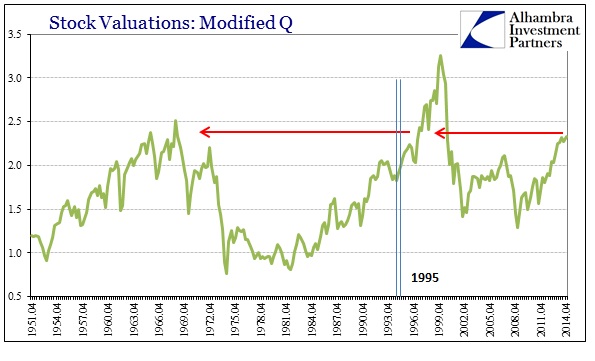
It is for that reason that I modify Tobin’s Q by subtracting back corporate real estate from the asset side – thus removing a potential bubble in real estate justifying a bubble in stock prices. The difference between the raw Q ratio and its modified image shows us more than a minor difference in valuations. This same divergence, presented immediately above, appeared toward the end of the housing bubble era too, around the middle of 2006 until the crash. More recently, despite all the revisions, the modified Q version suggests far greater stock price imbalance to economic fundamental value in both recent comparisons (of and after QE’s) and in the historical context.
Valuations aside, what I believe really shows us the utter insanity of the asset bubbles is the inefficiency with which all this price activity actually accomplishes anything toward the actual goal of economic advance. The Yellen Doctrine dictates the use of asset bubbles as tools for economic management, which if successfully implemented means eventual ex post facto justification of them and therefore no bust (no bust, no bubble). The problem with that thinking is very familiar, as the immutable size of the asset bubbles takes precedence over any forward economic “momentum.”
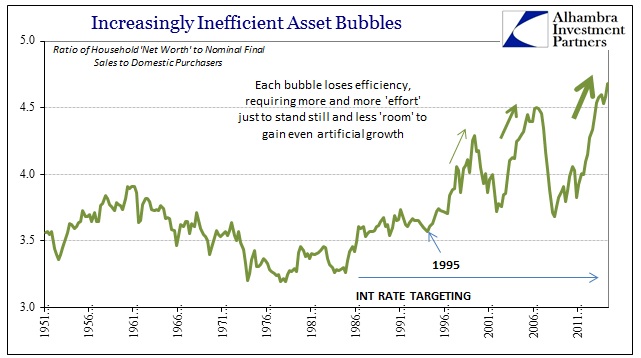
What I mean by that is these great financial imbalances require so much financial “energy” and effort to maintain that there is little left with which to gain even artificial economic advance (think corporations borrowing immensely not for economic projects but for repurchases and thus inefficient recycling of credit supply through stock prices). Out of all the Z1 data, I think this is the most important and damning in terms of monetary theory. As is clear below, the size of each bubble continues to grow compared to the economic growth “driven” by them.
I have taken the estimates for Household Net Worth from Z1 (upward revised, of course, but in this case that makes this comparison worse) compared to nominal Final Sales to Domestic Purchasers from the BEA’s GDP figures. If there is a “wealth effect” this would be the place to see it; net worth contains all the components of financial price inflation, while final sales isolates consumer spending regardless of where the goods or services are produced. If asset inflation is efficient, it should produce final sales at at least a near-constant rate.
As is plain above, not only do the asset bubbles fail to do so they have become astoundingly inefficient with each discrete application (the third this century plainly in progress). It is truly dumbfounding that monetary theorists continue to assert that asset bubbles and the “wealth effect” have any place in economic growth. The reliance on the counterfactual, that it would be worse without them, grows stale with each passing revision. We can see the same effects on more than just final sales, as the ratio of full-time employment to population gains corroborates that negative assessment. The more the asset bubbles go out of all sense of propriety and alignment, the worst the economy becomes.
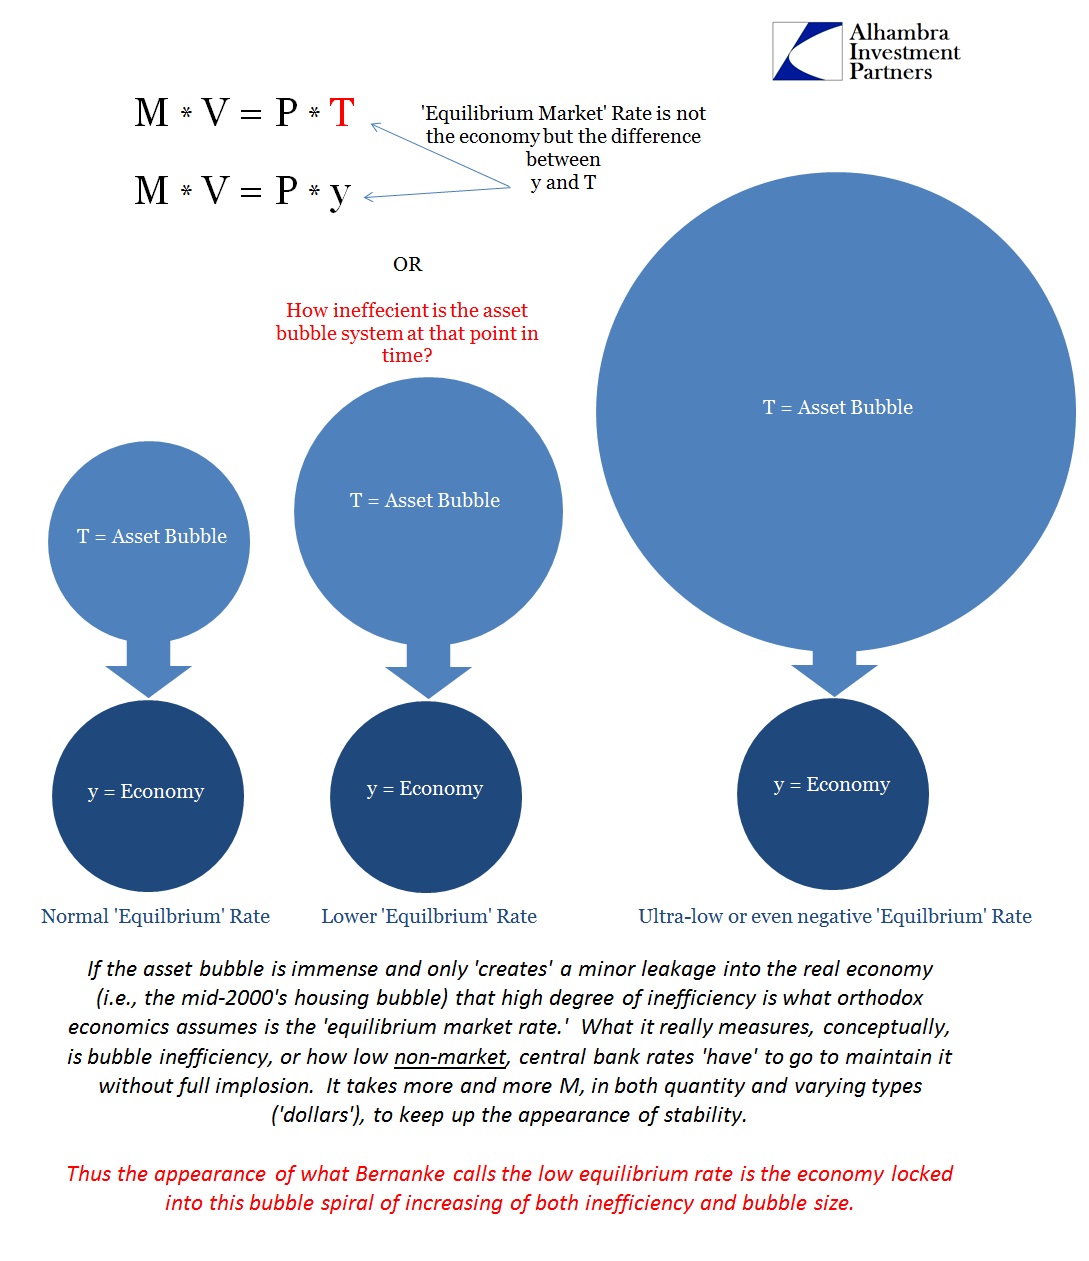
Orthodox economics has declared that secular stagnation, and an economic problem that the asset bubbles themselves are now couched as combating, but that is pure, unadulterated nonsense. The calculation demanded by secular stagnation, a negative natural rate of interest, only proves the error – the negative “natural” rate does not denote what the economy “requires” but rather what the asset bubbles do over and above the economy. Thus, any negative rate assertion is really the same variable as shown above, namely bubble inefficiency – the lower the rate, the greater the bubble “needed” to generate leakage to economic activity; i.e., inefficiency. No surprise that is what we see here.
With the economy stagnating yet again, the reality of the mismatch of asset inflation in hoping to generate consumer inflation and the real economy grows even more desperate. In terms of the Yellen Doctrine, the necessary growth ahead of us just to justify the asset bubbles already behind us is on an exponential trajectory, even if the actual economic growth is not; which is all yet another version of the same, ridiculous idea of some negative natural interest or, in this version, discount rate.

