There’s been no economic data of note in recent days so let’s take a look again at some of the banking and central banking indicators that are so critical to the markets.
On Tuesday I reported on how the Fed is still furtively pumping cash into the markets. I also alluded briefly to the fact that the Fed isn’t the only game in town. The BoJ and ECB are still frantically pumping money into not only their own markets, but to others as well, especially to the US.
All financial roads ultimately lead to Wall Street. The US markets may be crooked; they may be rigged. But they are still, the largest, most transparent (that’s not saying much), and most liquid in the world. When the Fed or ECB or BoJ pump money into the system, they do so mostly through the same mega investment banks that operate in all markets. That’s why I say “Liquidity anywhere is liquidity everywhere.”
So the Fed’s cohorts continue to pump money into the world financial pool. The BoJ has been pumping the dollar equivalent of som $80 billion per months. The ECB announced in early December that it would cut its monthly bond purchases from €80 billion to 60 billion.
My focus is mostly on the ECB because the flows between Frankfurt, London, and New York are so massive and so important to the performance of US markets. In past reports here I have demonstrated the strong correlations between ECB actions, European banking system responses, and US market performance. In fact the ECB seems as important in some ways as the Fed in driving US securities markets, particularly the US Treasury market. European banks are big investors in Treasuries.
Total assets on the ECB balance sheet increased by €67 billion over the 4 weeks ended January 13, 2017. These funds flow into the European banking system. In recent months European banks have been extinguishing this money by using it to pay down outstanding debts. This has resulted in declining deposits in the European banking system. While the December data showed stabilization in some countries’ deposits, there’s no sign of the trend turning positive.
Some of those funds flow out of the Eurozone banks and are used to purchase US Treasury securities, ultimately boosting deposits in the US banks. As long as the ECB prints money and then penalizes it with negative rates, this will result in negative rates on some European sovereign securities. Investors seek to avoid that by buying US securities.
Bank deposits in Europe have been downtrending since last July. This reflects the perverse incentives inherent in NIRP. I wrote last October that “If this gains traction, it will mean big trouble for not only Europe but the US as well as the incentives toward deposit contraction will turn into outright liquidation of assets.”
In fact that is exactly what happened. The US Treasury market came under a withering wave of liquidation from July to December. Stocks bucked the trend as investors misinterpreted the bond selloff to be signaling renewed US economic growth and inflation.
The institution of negative rates in Japan in early 2016 suppresses lending and deposit growth there also.
Because US paper still carries a positive yield, cash has continued to flow into the US, boosting US market liquidity. That could keep bids under US stocks and bonds intermittently and cause the US markets to move in a herky jerky- stop-start affair as waves of foreign cash seeking a haven in the US alternate with waves of liquidation and capital destruction around the world. Ultimately this should devolve into bear markets as world wide investment confidence, and confidence in central bank market propping, wanes.
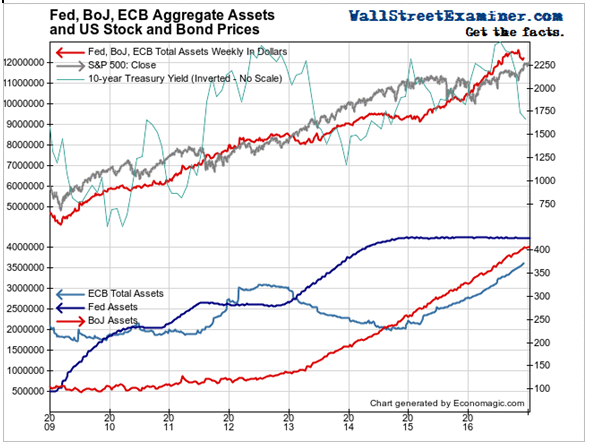
The correlation between the size of the ECB, Fed and BoJ balance sheets and the direction of financial asset prices is no accident. Treasury prices have mostly correlated with the ECB’s balance sheet, while stock prices have marched almost in lockstep with the Fed’s and BoJ’s.

The total of the dollar equivalent of the ECB and BoJ QE programs fell over the past couple of months, but not because they stopped buying. The strengthening dollar reduced the impact in dollar terms. The trend is still up, and will continue to be up as long as the two big central banks continue their programs.
It is striking that the bond market has gone the other way. Is this a temporary phase like 2012-13, or something bigger. I think it’s the latter, given the grave condition of the European banking system. Their need to raise cash will mean that they will continue to intermittently liquidate their US Treasury holdings, putting pressure on the Treasury market.
As goes the money printing in the US, Europe and Japan, so go the US markets. The Fed need not print because some of the money from ECB and BoJ printing always flows into the US. So stocks and bonds move in the same direction as ECB and BoJ QE.
Where bears may have a toehold is in the fact that while the direction is the same, the proportion is not. ECB and BoJ QE are running into more and more friction as account holders in those markets slowly but surely find ways to deleverage and extinguish deposits. Eventually, the markets could take over that function via margin calls. We’re not there yet, but QE no longer has the same market moving power that it once did.
This report is derived from Lee Adler’s Wall Street Examiner Pro Trader Monthly Macro Liquidity Reports.
Lee first reported in 2002 that Fed actions were driving US stock prices. He has tracked and reported on that relationship for his subscribers ever since. Try Lee’s groundbreaking reports on the Fed and the Monetary forces that drive market trends for 3 months risk free, with a full money back guarantee. Be in the know. Subscribe now, risk free!


