The mainstream media took note of weakening auto sales in June, a trend that we have been reporting on since last year. As usual the tendency of the financial infomercial media was to couch the weakness in positive terms, as exemplified by this headline from CNBC.com:
Economy is strong, but auto sales drop in 1st half of year
The Wall Street Journal was a little less positive, asking:
Car Buying Stalls, Can Consumers Keep Spending?
The AP, whose reporting was featured on CNBC.com added that:
U.S. auto sales fell 3 percent last month.
It was the sixth straight monthly decline as sales dropped off last year’s record pace. For the first six months, car and truck sales fell 2.1 percent, the first such decrease since the financial crisis in 2009.
But auto executives and industry analysts say it’s no cause for panic. Sales are still strong and aren’t expected to plunge anytime soon.
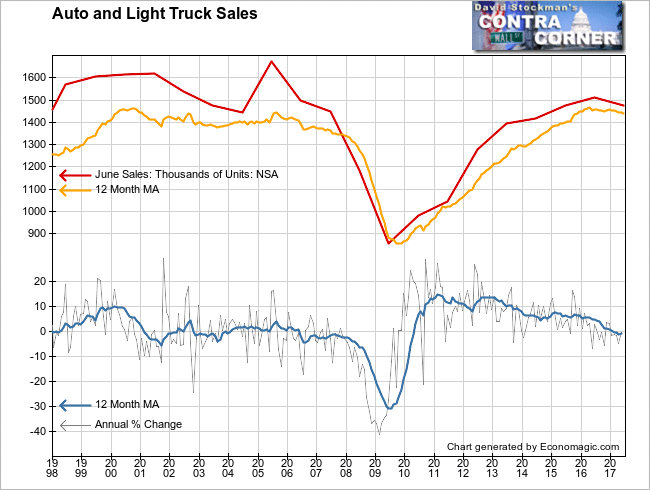
We have actually noticed negative year to year comparisons beginning in May of 2016. That was interrupted a couple of times, but that’s when the downtrend started.
Unlike most economic data, this data is not seasonally adjusted (NSA), so there’s no need to explain away the misimpressions usually created by seasonally adjusted data (SA). We merely need to look at the month to month change relative to the June change in past years, and to the momentum of the annual rate of change over the past year to get a handle on the direction of the market.

We can see the subtle rollover in sales that began last year. At the bottom of the chart we see the rate of change graph showing the initial contraction in the year to year comparison that began in May of last year, which the mainstream media seemed to miss. Being the contrarians that we are, we must wonder if, now that they have noticed the decline, the trend might not be ready for a bounce.
As a bear on the markets, that wouldn’t concern me because positive numbers at this stage of the cycle are bearish. They encourage the Fed to remain on a course of tightening. Monetary policy tightening is what kills bubbles. The Fed did it in 2000. They did it in 2007, and they’re doing it again today.
For now, the numbers on auto sales are negative, but they are barely below their peak levels of the past 18 years. The auto sales bubble hasn’t quite cracked yet. We note that a similar shift to negative growth occurred in 2006. That marked the top of the housing bubble, and was the precursor to the 2007 stock market top by about a year.
In 2000, the downturn in auto sales followed the downturn in stocks. In 2000, the tech bubble had been the driver of bubbly auto sales. In 2006, the housing bubble, and the home equity extraction that resulted, drove car sales. Over the current cycle, it has probably been a bit of both. Housing inflation is still raging but stock market gains have slowed to a crawl. After 7 years of recovery, auto sales momentum seems to have reached exhaustion.
Consumers certainly aren’t running out to buy new cars on all the new low wage jobs being spawned in the US economy today. No, auto sales are joined at the hip with the twin bubbles in housing and real estate. Cooling in auto sales should be a reliable, concurrent, if not leading, indicator for the markets in this cycle.

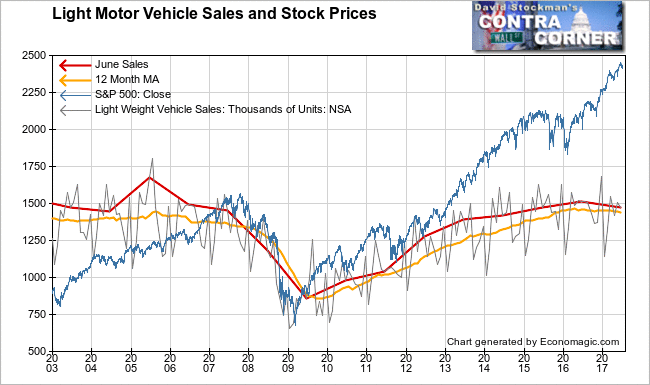
Stock prices have sailed off into the wild blue yonder as auto sales growth has tailed off since 2014. This is just more evidence that an increasing slice of the US population is not participating in the gains of this expansion. Top line growth is skewed by those with top of the heap incomes. People in the middle income strata and below have not been able to increase their spending on big ticket items like cars.
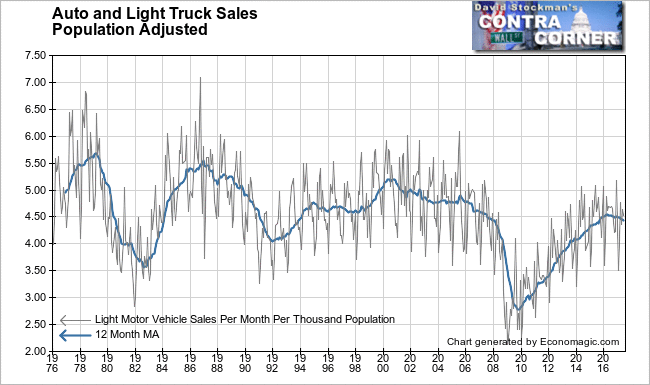
The chart below clearly shows the degrading standard of living in the US over the past 4 decades. In 1979 a monthly average of 5.6 cars were sold per thousand persons in the US. At the bottom of the 1982 recession that rate dropped to 3.6. In the expansion of the mid 80s, sales peaked at a monthly average of 5.5 per thousand. The rate at the bottom of the 1992 recession suggested a positive turn, as sales only fell to 4 per thousand.

But that apparent improvement proved to be a mirage. Sales peaked at 5.2 per thousand at the top of the tech bubble in in 2000. Then they set a new record low in 2009, finally bottoming at 2.8 per thousand of population. After the longest and most persistent recovery on record, sales have apparently again peaked. This time that peak is at 4.5 per thousand. The 13% decline from the peak of 17 years ago is a measure of the dropout rate of consumers with the ability to purchase a new car.
This occurred with the benefit of ZIRP driving auto finance rates to record lows, along with a rising stock market throughout the 8 years of recovery. As the Fed continues to tighten policy in the current cycle, sales should be further constrained. The Fed is unlikely to loosen policy again until auto sales have a sustained decline.
As auto sales show, the ability of American business to increase revenues by selling more products to more Americans has weakened over the past couple of decades. The more business tries to increase profits by cutting jobs the worse the trend will become. Replacing high priced labor with robots, drones, and low priced labor will only reinforce the trend of slowing sales, as more folks fall out of the middle class. It is a vicious cycle.
This trend is already entrenched, and there is no reason to believe that it will change. It does not bode well for the US economy. And in the absence of central bank QE feeding into the stock market, it does not bode well for the future of stock prices. There’s no fundamental support for prices at these levels without the Fed pumping them up.
From this perspective, the strategy that makes the most sense is to sell the rallies and to look for short positions or even long term puts in industries most likely to suffer from these trends. Autos look like one of those groups.


