U.S. Durable Goods Orders Fell 1.1% in May, screamed the Wall Street Journal headlines late last month. The Journal excused the “bad” news by attributing it to the volatile aircraft sector. “Demand for long-lasting factory goods declined in May for the second straight month, driven by a pullback in airplane orders as the U.S. manufacturing sector continues to find its footing.”
In other words, “Move along, nothing to see here.”
Economists missed badly in their guesses on the headline number. Their consensus guess was for a decline of 0.4%.
The rest of the news coverage was a head spinning series of “on the one hand, on the other hand,” observations. In fact, both the headline numbers and the underlying data were misleading, thanks to a faulty seasonal adjustment. The actual numbers were far stronger than the headline numbers. At this stage of the cycle, that is NOT bullish.
As usual, the media focused only on the seasonally adjusted (SA) data, which is often wrong but never in doubt. The SA data gets repeatedly revised over 5 years to fit actual experience as more data becomes available. The first 2 monthly revisions are often large enough to reveal that the initial release was so far off the mark as to be misleading. That was what happened with this report.
The only way to know whether that’s the case is to look at the actual, not seasonally adjusted (NSA) data in the first place. It is far more accurate and is usually subject to only minor revision, and that usually only in the first month after the initial release. We need only do the most basic of comparisons to determine whether the number was strong, weak, or indifferent.
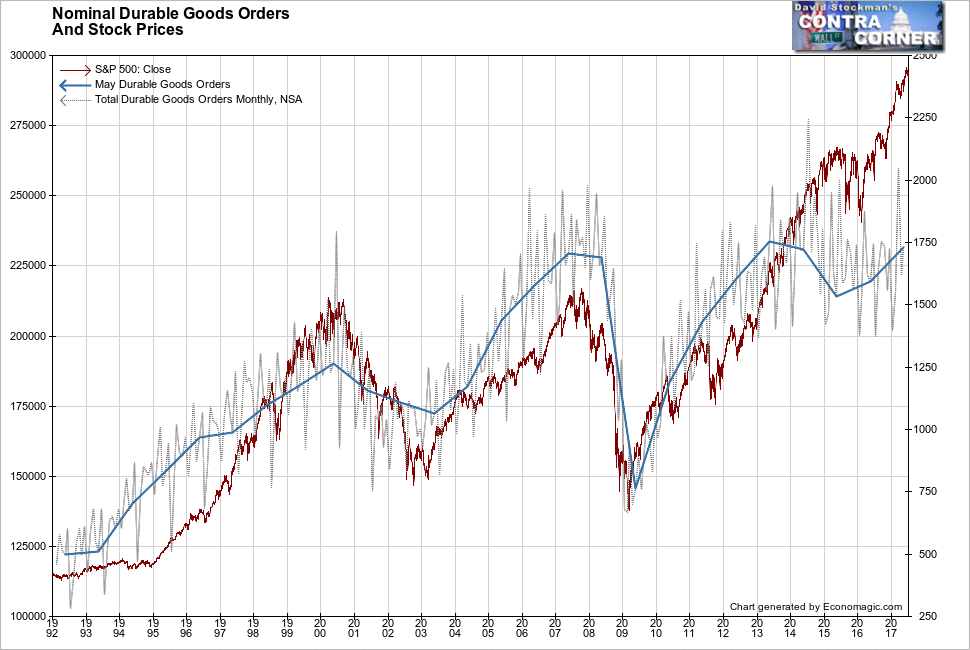
So that’s what we do–focus on the actual data, without applying andy statistical manipulation. It showed a month to month gain of 4.5% in May. That’s actually a pretty good number for May. May of 2016 saw a 1% decline. The average change for May over the previous 10 years was +1.6%. This May certainly wasn’t as bad as the headlines portrayed.
The year to year gain was a healthy 5.7%. Annual momentum has improved over the past 3 months. And prior to the middle of last year, durable goods orders had been contracting for about 18 months.
The problem is still a yawning divergence between this data and stock prices. Whereas durable goods orders have yet to exceed the peak recovery levels hit in 2013, the stock market has bubbled ferociously higher.

Initially that divergence was driven mostly by Fed QE and ZIRP. They encouraged financial engineering and speculative behaviour that led to massive expansion of PE multiples. But Fed QE ended at the end of 2014. The ECB and BoJ took the handoff from the Fed since then. As they have continued QE, foreign capital has continued to flow into the US, driving the asset bubble in stocks and causing it to separate from the norm normal correlation with stock prices of the past 25 years.
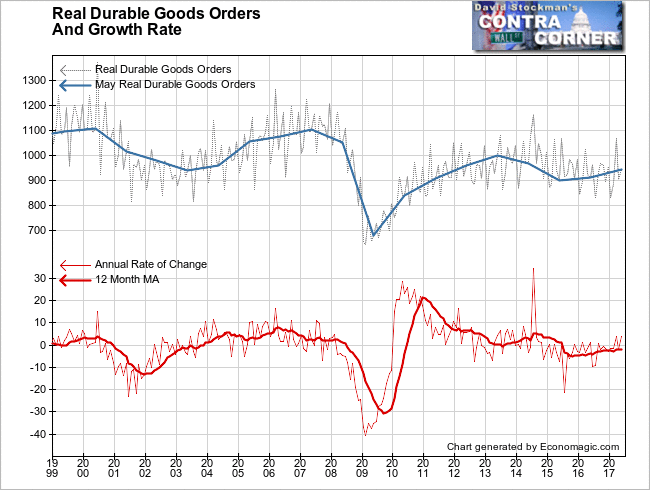
The durable goods data is that it includes inflation. Given even modest inflation, the nominal data outperforms inflation adjusted data. The numbers are compiled on the basis of the dollar value of sales, not the unit volume. To get a better view of the real trend, we need to make a stab at adjusting for inflation. To that end I use the Producer Price Index as the divisor.
On that basis the gains were still relatively robust. The month to month increase was 4.4%. Annual growth was 3.7% after adjusting for inflation. That’s pretty hot growth. The problem is in the long term trend. Growth has been slowing since the initial recovery surge in 2010. In real terms, new orders are not only below the level of the 2013 recovery peak, they are also below the peaks of 2007 and 2000. The often touted recovery in US manufacturing just is not happening. It’s pure fantasy on the part of mainstream economists and their media handmaidens.

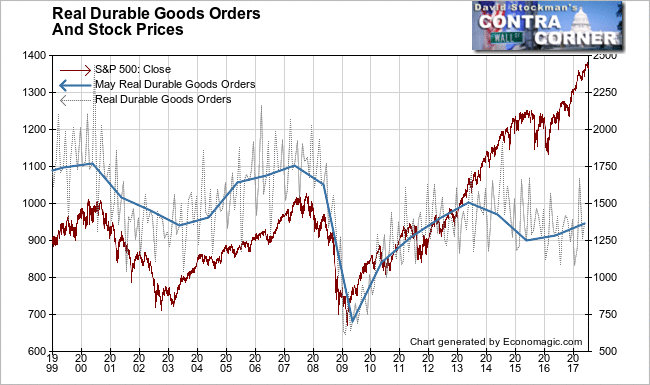
Using inflation adjusted data, the divergence with stock prices is even more striking. It is a testament to just how much of the stock market’s gains have been due to financial engineering. But that financial engineering has been fading away over the past year. The growth rate in business loans has been cratering according to the Fed’s weekly data on Commercial and Industrial Loans. CEOs are no longer interested in borrowing money to pay for stock buybacks that enable them to sell their option grants at record prices.

There’s a yawning gap between economic reality as represented by real durable goods orders, and the fantasy that drove the rationalization of the stock market bubble. That gap will begin to close when the Fed starts the process of what it calls “balance sheet normalization.” That’s a euphemism for “tightening.”
The Fed has announced its intention to start shrinking its balance sheet soon. That means that each month the Fed will require repayment of some of the debt it purchased under QE. This will be a real tightening that persistently drains funds from the financial system. The Treasury will add supply to the market as it sells new debt to raise the cash to repay the Fed. Dealers and other institutional accounts will be forced or will choose to absorb the new Treasury paper, diverting some purchases that in the past would have gone to buy equities. Unlike during QE the dealers will need to absorb the new paper without the help it had been getting from the Fed.
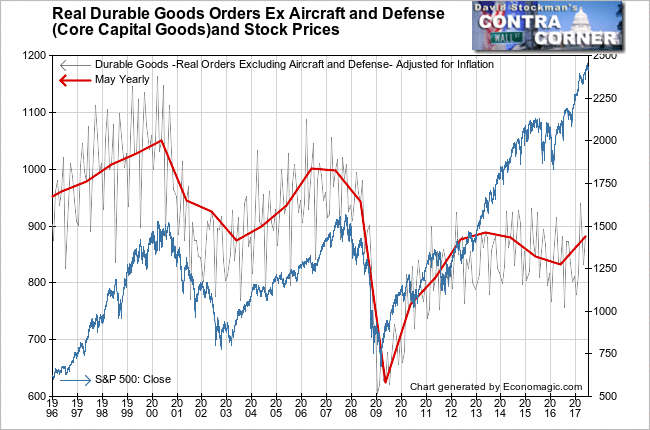
Real Durable Goods Orders Ex Aircraft and Defense, aka Core Capital Goods, is a good measure of business attitudes and actions regarding business investment. Ironically, it has actually begun to strengthen this year after the Fed stopped QE and ZIRP. Doing so ended the Fed’s outright subsidy and promotion of the financial engineering schemes that have driven the stock price bubble. Over the past year, businesses have actually been directing spending toward tangible capital investment instead of directing capital to lining their own pockets with stock buybacks.
Real core capital goods orders rose by 3.4% from April to May and by a robust 5.1% year to year. Even with that gain it has barely begun to close the massive gap between the value of real capital investment, and the inflation of fictitious capital, represented by rising stock prices.

Ironically, businesses may continue to expand their core capital goods purchases as the Fed tightens. Contrary to conventional wisdom, this will be bearish. Under QE and ZIRP, CEOs went for the quick buck of stock buybacks, driving stock prices higher. QE and ZIRP encouraged dealers, hedge fund, speculators, and institutional investors to pile on. The Fed is about to make that game much less attractive, and businesses are now beginning to divert available capital to real investment rather than financial speculation. These actions will reduce the funding available to the financial engineering games that drove the bubble. It will compound the negative effects of the Fed’s active draining of funds from the financial system.
Remember! Stock markets top out when the news is good. As the economy heats up concurrent with the Fed tightening shrinking capital will be diverted from financial market speculation to real capital investment. The apparent increase in economic activity will encourage the central bank, fearing a buildup of consumer price and wage inflation, to tighten policy. This will trigger a new bear market.


