
The size of the Fed’s balance sheet fluctuates between $4.39 trillion and $4.50 trillion each month as MBS are paid down and then more are purchased to replace the paper that was paid down. While the Fed’s balance sheet is not expanding, the Fed continues to pump cash into Primary Dealer accounts via mid month MBS purchase settlements of forward purchase contracts from the previous 2 months. The dealers use that cash for whatever they want, including the purchase of more MBS, or Treasuries, or even stocks. That cash helps to rig the markets, for now keeping the bias to the upside. But pressures are building that could reverse the tilt of the playing field.

Source: Fed H.4.1
The Fed’s liabilities include bank reserve deposits which are created when the Fed buys securities from dealers. The other big line items of interest to us are the US Treasury account, which is where the Federal Government holds all its cash, Reverse repurchase agreements (RRP), and Other.

Source: Fed H.4.1
The US Treasury’s deposits at the Fed rose by $50.7 billion since the end of August. This leaves the Treasury’s cash balance at a record for this date. The buildup of Treasury cash follows the Treasury Borrowing Advisory Committee’s (TBAC) recommendation last year that the Fed build a “rainy day fund.” I’d call it political slush fund to be used to goose the economy by spending a little more in a given month to boost the Administration’s political goals. Look for a big drawdown in October.
Regular bank reserve deposits, called “Other deposits held by depository institutions” fell by a ridiculous $145 billion since the end of August. But fear not! It was just the Fed and the banks conspiring to push the spaghetti around on the plate.
The Fed encourages end of quarter window dressing so that the banks and money market funds can show that they’re holding lots of the highest quality short term paper. The banks shift funds from their reserve deposit accounts at the Fed to overnight RRP accounts. RRPs spike into the hundreds of billions on the last day of the quarter, then return to less than $100 billion in the first days of the new quarter. Money has been neither created nor destroyed. It has just scurried from under one track to another, like a New York subway rat.
Bank loans edged to another new all time record in mid September. The growth rate has been between 7% and 8.5% since December 2014. And yet, mainstream economists don’t seem to be worried that this might be another bubble, just like the other bubble.
Data Source: Fed H8
Lending not related to financing securities holdings has continued to plow to new highs. This includes both consumer lending and commercial and industrial lending. Pundits who complain about weak lending or slow credit growth are either ignorant or lying, plain and simple.

This report is a condensed version of the Wall Street Examiner Pro Trader monthly report on the condition of the Fed balance sheet and US banking system data. Try the service for 90 days risk free.
Data Sources: Fed and BEA
Meanwhile, the Fed stopped printing at the end of 2014, but loan growth remains overheated. How do we know it’s overheated, and at best useless, if not counterproductive? Because while the annual rate of loan growth has surged from under 4% to around 8% since early 2014, GDP growth has slowed from a reported 5% in mid 2014, to under 2% today. When the quarterly annualized growth rate printed near 5%, in 2014, that was an artifact of seasonal adjustment error, but the annual growth rate was over 3% at that point.
So much for the theory that tight credit was holding back growth. Like most economic theories, there’s no support for it. In fact, increasing debt seems to hold back growth. Wouldn’t it make sense that when the debt load gets too high, that would begin to restrain growth? Not to economists.
As loans outstanding have soared and GDP growth has slowed, you would think that bankers might recognize the increasing risk and set aside a bit more in reserves. But they haven’t seen it that way. They cut loss reserves from $170 billion to $106 billion between 2012 and mid 2015. Since then they rebuilt reserves by a whole $3 billion while non repo loans grew by $685 billion.

Data Source: Federal Reserve H8
Commercial and Industrial lending growth is slowing, dropping from a growth rate of more than 13% in early 2015 to around 9% today. That’s still a hot growth rate, but pent up loan demand is slowly melting away. Meanwhile, data on real business investment in plant and equipment continues to shrink. Bankers may be confident in their future prospects, but their biggest customers apparently are not.

The C&I Loan growth rate has slowed but is still extremely high in relation to fixed investment. That borrowing continues to buttress the stock market bubble as corporate CEOs use it to buy back their stocks. The current growth rate of C&I loans of 9% can only be attributed to these ongoing financial engineering schemes. Some of the funds are used to buy back the stock options previously granted to executives. Such dishonest schemes will ultimately end badly, but for now everybody’s a winner at the Wall Street Casino.
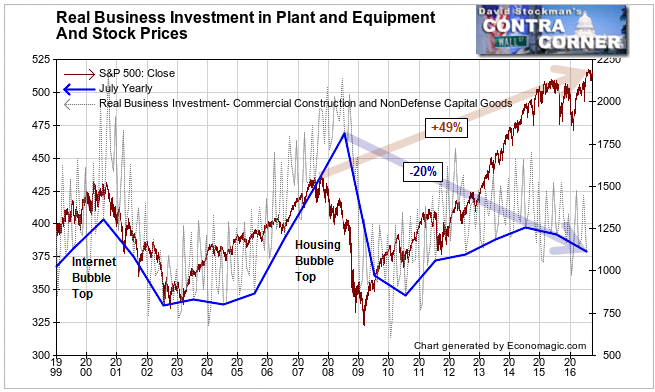
Data compiled from Census Bureau reports and adjusted by BLS PPI data.
Finally, repo loans to nonbanks to finance carry trades and other securities holdings spiked to an all time high in mid September, then pulled back to the top of the year long range just as quickly. There was clearly something unusual going on there, but we don’t know what it was.

This measure usually correlates almost perfectly with the prices of Treasury notes. Repo borrowing may just be having a delayed reaction. In June-July Treasury prices soared while repo loans shrank.
This recent move has resulted in a new uptrend channel after a lengthy consolidation. That inflection point had apparently resolved to the upside, but the immediate pullback raises questions of whether it was just a blowoff similar to the spike in late 2012 that was coincident with an important intermediate top in Treasury prices. We don’t know what this move means yet, but it bears watching as a clue to the future of Treasury yields.
This report is a condensed version of the Wall Street Examiner Pro Trader monthly report on the condition of the Fed balance sheet and US banking system data. Try the service for 90 days risk free.

